
Note
Go to the end to download the full example code.
Bag-of-SFA Symbols (BOSS)#
Bag-of-words approaches are common in time series classification. The
Bag-of-SFA Symbols (BOSS) algorithm extracts words from time series and
builds features representing frequencies of each word for each time series.
This example illustrates the words and the frequencies of these words that
have been learned by this algorithm.
It is implemented as pyts.transformation.BOSS.
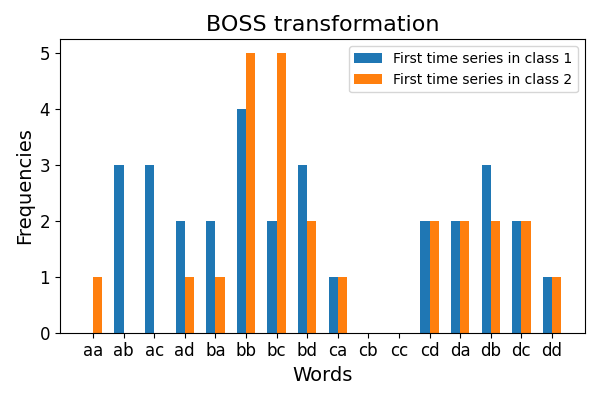
# Author: Johann Faouzi <johann.faouzi@gmail.com>
# License: BSD-3-Clause

import matplotlib.pyplot as plt
import numpy as np

from pyts.datasets import load_gunpoint
from pyts.transformation import BOSS

# Toy dataset
X_train, _, y_train, _ = load_gunpoint(return_X_y=True)

# BOSS transformation
boss = BOSS(word_size=2, n_bins=4, window_size=12, sparse=False)
X_boss = boss.fit_transform(X_train)

# Visualize the transformation for the first time series
plt.figure(figsize=(6, 4))
vocabulary_length = len(boss.vocabulary_)
width = 0.3
plt.bar(
    np.arange(vocabulary_length) - width / 2,
    X_boss[y_train == 1][0],
    width=width,
    label='First time series in class 1',
)
plt.bar(
    np.arange(vocabulary_length) + width / 2,
    X_boss[y_train == 2][0],
    width=width,
    label='First time series in class 2',
)
plt.xticks(
    np.arange(vocabulary_length),
    np.vectorize(boss.vocabulary_.get)(np.arange(X_boss[0].size)),
    fontsize=12,
)
y_max = np.max(np.concatenate([X_boss[y_train == 1][0], X_boss[y_train == 2][0]]))
plt.yticks(np.arange(y_max + 1), fontsize=12)
plt.xlabel("Words", fontsize=14)
plt.ylabel("Frequencies", fontsize=14)
plt.title("BOSS transformation", fontsize=16)
plt.legend(loc='best', fontsize=10)
plt.tight_layout()
plt.show()
Total running time of the script: (0 minutes 0.180 seconds)