Note
Click here to download the full example code
Time Series Forest
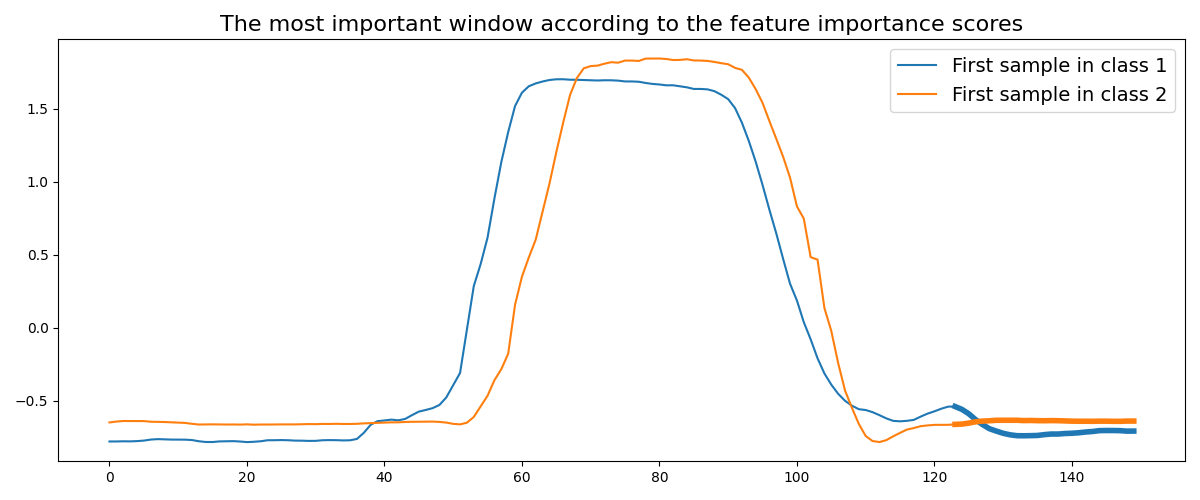
This example illustrates which information is considered important
by the algorithm in order to classify time series. The index of
the most important window is retrieved via the feature_importance_
and indices_ attributes. The first time series for both classes
are plotted and the most important window is highlighted with a
larger line width.
It is implemented as pyts.classification.TimeSeriesForest.
# Author: Johann Faouzi <johann.faouzi@gmail.com>
# License: BSD-3-Clause

import numpy as np
from pyts.datasets import load_gunpoint
from pyts.classification import TimeSeriesForest
import matplotlib.pyplot as plt

X_train, X_test, y_train, y_test = load_gunpoint(return_X_y=True)
clf = TimeSeriesForest(random_state=43)
clf.fit(X_train, y_train)

start_idxmax, end_idxmax = clf.indices_[
    np.argmax(clf.feature_importances_) // 3]

plt.figure(figsize=(12, 5))
plt.plot(X_train[y_train == 1][0], label='First sample in class 1')
plt.plot(np.arange(start_idxmax, end_idxmax),
         X_train[y_train == 1][0, start_idxmax:end_idxmax],
         color='C0', lw=4)

plt.plot(X_train[y_train == 2][0], label='First sample in class 2')
plt.plot(np.arange(start_idxmax, end_idxmax),
         X_train[y_train == 2][0, start_idxmax:end_idxmax],
         color='C1', lw=4)

plt.legend(loc='best', fontsize=14)
plt.title('The most important window according to the feature importance '
          'scores', fontsize=16)
plt.tight_layout()
plt.show()
Total running time of the script: ( 0 minutes 1.733 seconds)
