Note
Click here to download the full example code
Time Series Bag-of-Features
This example illustrates the feature importance scores of the final random forest classifier of the time series bag-of-features (TSBF) algorithm. Fitting this algorithm consists of the following steps:
- Random subsequences are extracted from each input time series.
- Each subsequence is split into several intervals.
- Three features are extracted from each interval: the mean, the standard deviation and the slope.
- Four features are also extracted from the whole subsequence: the mean, the standard deviation and the start and end indices.
- A first random forest classifier is fitted on this dataset of subsequences, and the label of a subsequence is given by the label of the time series from which this subsequence was extracted.
- Out-of-bag probabilities for each class are binned across all the subsequences extracted from a given time series; the mean probability for each class is also computed. They are the features extracted from the original data set.
- A second random forest classifier is finally fitted using the extracted features.
The number of extracted features is (n_bins + 1) * n_classes, where
n_bins is the number of bins used to bin the probabilities output by the
first random forest classifier, and n_classes is the number of classes. In
this example, the number of classes is 2 and the number of bins is set to 5
(meaning that the bin edges are [0.0, 0.2, 0.4, 0.6, 0.8, 1.0]), resulting in
12 features.
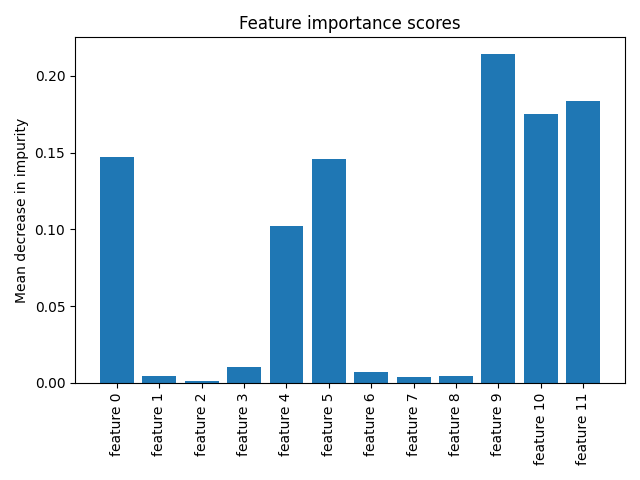
Plotting the feature importance scores, we can see that the second random forest classifier finds the mean probabilities and most of the extreme bins important:
- feature 0: bin [0.0, 0.2) for the first class,
- feature 4: bin [0.8, 1.0] for the first class,
- feature 5: mean probability for the first class,
- feature 9: bin [0.6, 0.8) for the second class,
- feature 10: bin [0.8, 1.0] for the second class,
- feature 11: mean probability for the second class.
It is implemented as pyts.classification.TSBF.
# Author: Johann Faouzi <johann.faouzi@gmail.com>
# License: BSD-3-Clause

import numpy as np
from pyts.datasets import load_gunpoint
from pyts.classification import TSBF
import matplotlib.pyplot as plt

X_train, X_test, y_train, y_test = load_gunpoint(return_X_y=True)
clf = TSBF(random_state=43, bins=5)
clf.fit(X_train, y_train)

plt.bar(np.arange(clf.n_features_in_), clf.feature_importances_)
plt.title('Feature importance scores')
plt.xticks(np.arange(clf.n_features_in_),
           ['feature {}'.format(i) for i in range(clf.n_features_in_)],
           rotation=90)
plt.ylabel("Mean decrease in impurity")
plt.tight_layout()
plt.show()
Total running time of the script: ( 0 minutes 4.504 seconds)
