Note
Click here to download the full example code
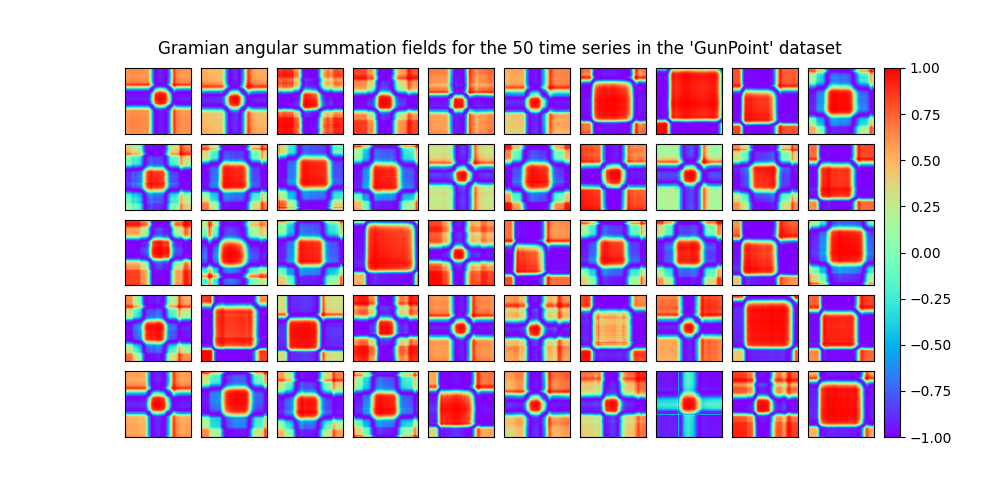
Data set of Gramian angular fields
A Gramian angular field is an image obtained from a time series, representing
some kind of temporal correlation between each pair of values from the time
series. Two methods are available: Gramian angular summation field and Gramian
angular difference field.
It is implemented as pyts.image.GramianAngularField.
In this example, we consider the training samples of the GunPoint dataset, consisting of 50 univariate time series of length 150. The Gramian angular summation field of each time series is independently computed and the 50 Gramian angular summation fields are plotted.
# Author: Johann Faouzi <johann.faouzi@gmail.com>
# License: BSD-3-Clause

import matplotlib.pyplot as plt
from mpl_toolkits.axes_grid1 import ImageGrid
from pyts.image import GramianAngularField
from pyts.datasets import load_gunpoint

# Load the GunPoint dataset
X, _, _, _ = load_gunpoint(return_X_y=True)

# Get the Gramian angular summation fields for all the time series
gaf = GramianAngularField()
X_gaf = gaf.fit_transform(X)

# Plot the 50 Gramian angular fields
fig = plt.figure(figsize=(10, 5))

grid = ImageGrid(fig, 111, nrows_ncols=(5, 10), axes_pad=0.1, share_all=True,
                 cbar_mode='single')
for i, ax in enumerate(grid):
    im = ax.imshow(X_gaf[i], cmap='rainbow', origin='lower', vmin=-1., vmax=1.)
grid[0].get_yaxis().set_ticks([])
grid[0].get_xaxis().set_ticks([])
plt.colorbar(im, cax=grid.cbar_axes[0])
ax.cax.toggle_label(True)

fig.suptitle("Gramian angular summation fields for the 50 time series in the "
             "'GunPoint' dataset", y=0.92)

plt.show()
Total running time of the script: ( 0 minutes 4.552 seconds)
