Note
Click here to download the full example code
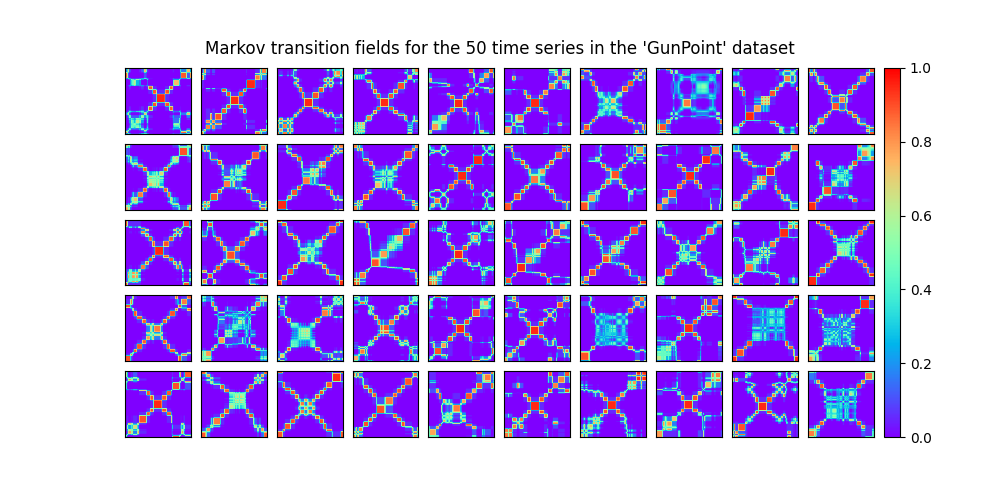
Data set of Markov transition fields
A Markov transition field is an image obtained from a time series, representing
a field of transition probabilities for a discretized time series.
Different strategies can be used to bin time series.
It is implemented as pyts.image.MarkovTransitionField.
In this example, we consider the training samples of the GunPoint dataset, consisting of 50 univariate time series of length 150. The Markov transition field of each time series is independently computed and the 50 Markov transition fields are plotted.
# Author: Johann Faouzi <johann.faouzi@gmail.com>
# License: BSD-3-Clause

import matplotlib.pyplot as plt
from mpl_toolkits.axes_grid1 import ImageGrid
from pyts.image import MarkovTransitionField
from pyts.datasets import load_gunpoint

# Load the GunPoint dataset
X, _, _, _ = load_gunpoint(return_X_y=True)

# Get the recurrence plots for all the time series
mtf = MarkovTransitionField(n_bins=8)
X_mtf = mtf.fit_transform(X)

# Plot the 50 Gramian angular fields
fig = plt.figure(figsize=(10, 5))

grid = ImageGrid(fig, 111, nrows_ncols=(5, 10), axes_pad=0.1, share_all=True,
                 cbar_mode='single')
for i, ax in enumerate(grid):
    im = ax.imshow(X_mtf[i], cmap='rainbow', origin='lower', vmin=0., vmax=1.)
grid[0].get_yaxis().set_ticks([])
grid[0].get_xaxis().set_ticks([])
plt.colorbar(im, cax=grid.cbar_axes[0])
ax.cax.toggle_label(True)

fig.suptitle("Markov transition fields for the 50 time series in the "
             "'GunPoint' dataset", y=0.92)

plt.show()
Total running time of the script: ( 0 minutes 4.045 seconds)
