Note
Click here to download the full example code
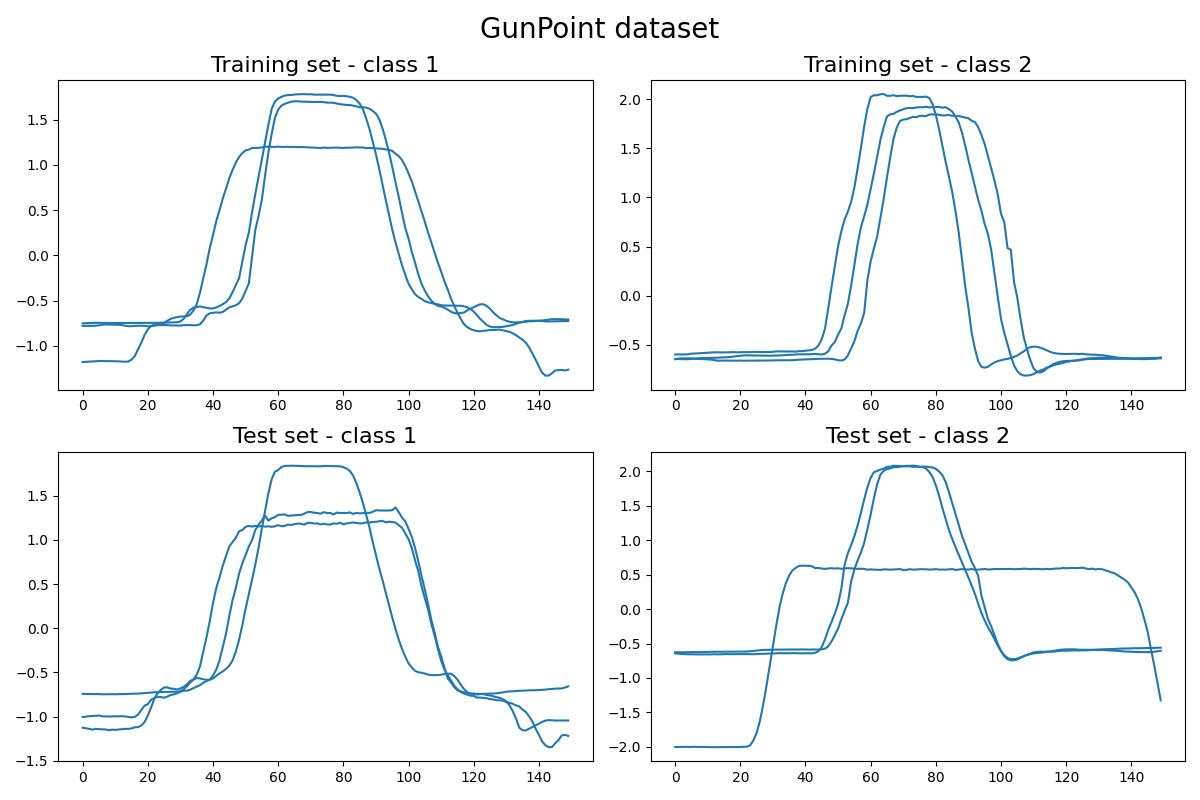
Loading the GunPoint dataset
This example shows how to load and plot the GunPoint dataset.
This dataset involves one female actor and one male actor making
a motion with their hand. The two classes are: Gun-Draw and Point:
For Gun-Draw the actors have their hands by their sides. They draw
a replicate gun from a hip-mounted holster, point it at a target for
approximately one second, then return the gun to the holster, and
their hands to their sides. For Point the actors have their gun by
their sides. They point with their index fingers to a target for
approximately one second, and then return their hands to their sides.
For both classes, we tracked the centroid of the actor’s right hands
in both X- and Y-axes, which appear to be highly correlated. The
data in the archive is just the X-axis.
It is implemented as pyts.datasets.load_gunpoint().
# Author: Johann Faouzi <johann.faouzi@gmail.com>
# License: BSD-3-Clause

import matplotlib.pyplot as plt
from pyts.datasets import load_gunpoint


X_train, X_test, y_train, y_test = load_gunpoint(return_X_y=True)
n_samples_per_plot = 3

plt.figure(figsize=(12, 8))

for i, (X, y, set_, class_,) in enumerate(zip(
    [X_train, X_train, X_test, X_test],
    [y_train, y_train, y_test, y_test],
    ['Training', 'Training', 'Test', 'Test'],
    [1, 2, 1, 2]
)):
    plt.subplot(2, 2, i + 1)
    for j in range(n_samples_per_plot):
        plt.plot(X[y == class_][j], 'C0')
    plt.title('{} set - class {}'.format(set_, class_), fontsize=16)

plt.suptitle('GunPoint dataset', fontsize=20)
plt.tight_layout()
plt.subplots_adjust(top=0.9, hspace=0.2)
plt.show()
Total running time of the script: ( 0 minutes 0.579 seconds)
