Note
Click here to download the full example code
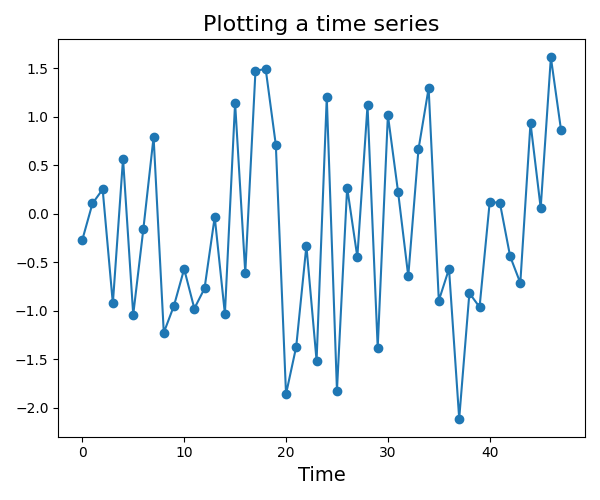
Plotting a time series
Visualizing data is important and should usually be the first step in any analysis. This simple example shows how to plot a single time series.
# Author: Johann Faouzi <johann.faouzi@gmail.com>
# License: BSD-3-Clause

import numpy as np
import matplotlib.pyplot as plt

# Parameters
n_samples, n_timestamps = 100, 48

# Toy dataset
rng = np.random.RandomState(41)
X = rng.randn(n_samples, n_timestamps)

# Plot the first time series
plt.figure(figsize=(6, 5))
plt.plot(X[0], 'o-')
plt.xlabel('Time', fontsize=14)
plt.title('Plotting a time series', fontsize=16)
plt.tight_layout()
plt.show()
Total running time of the script: ( 0 minutes 0.260 seconds)
