Note
Click here to download the full example code
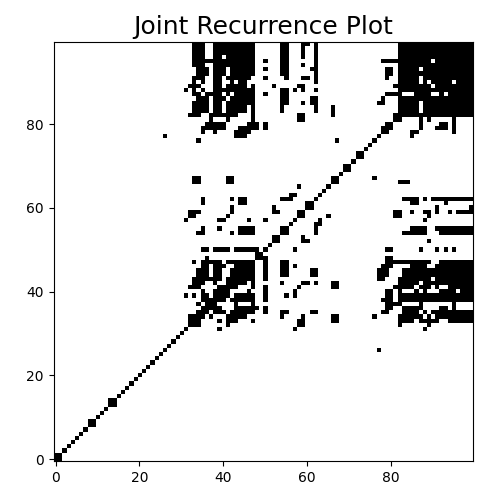
Joint Recurrence Plot
A joint recurrence plot is an extension of recurrence plots (
implemented as pyts.image.RecurrencePlot) for multivariate time
series. A recurrence plot is built for each feature of the multivariate
time series, then the set of recurrence plots is reduced to one single
recurrence plot using the Hadamard product.
This example illustrates this transformation. It is implemented as
pyts.multivariate.image.JointRecurrencePlot.
# Author: Johann Faouzi <johann.faouzi@gmail.com>
# License: BSD-3-Clause

import matplotlib.pyplot as plt
from pyts.multivariate.image import JointRecurrencePlot
from pyts.datasets import load_basic_motions

X, _, _, _ = load_basic_motions(return_X_y=True)

# Recurrence plot transformation
jrp = JointRecurrencePlot(threshold='point', percentage=50)
X_jrp = jrp.fit_transform(X)

# Show the results for the first time series
plt.figure(figsize=(5, 5))
plt.imshow(X_jrp[0], cmap='binary', origin='lower')
plt.title('Joint Recurrence Plot', fontsize=18)
plt.tight_layout()
plt.show()
Total running time of the script: ( 0 minutes 0.139 seconds)
