Note
Click here to download the full example code
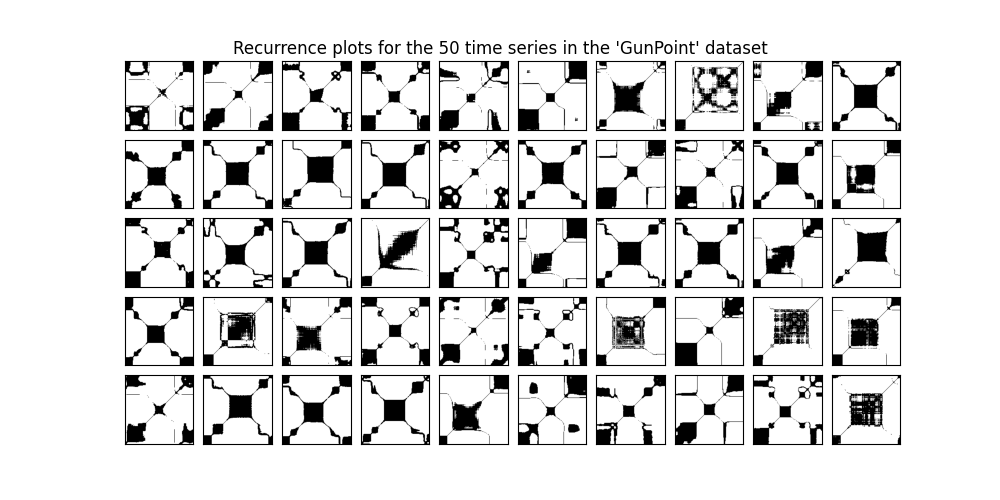
Data set of recurrence plots
A recurrence plot is an image obtained from a time series, representing the
pairwise Euclidean distances for each value (and more generally for each
trajectory) in the time series.
The image can be binarized using a threshold.
It is implemented as pyts.image.RecurrencePlot.
In this example, we consider the training samples of the GunPoint dataset, consisting of 50 univariate time series of length 150. The recurrence plot of each time series is independently computed and the 50 recurrence plots are plotted.
# Author: Johann Faouzi <johann.faouzi@gmail.com>
# License: BSD-3-Clause

import matplotlib.pyplot as plt
from mpl_toolkits.axes_grid1 import ImageGrid
from pyts.image import RecurrencePlot
from pyts.datasets import load_gunpoint

# Load the GunPoint dataset
X, _, _, _ = load_gunpoint(return_X_y=True)

# Get the recurrence plots for all the time series
rp = RecurrencePlot(threshold='point', percentage=20)
X_rp = rp.fit_transform(X)

# Plot the 50 recurrence plots
fig = plt.figure(figsize=(10, 5))

grid = ImageGrid(fig, 111, nrows_ncols=(5, 10), axes_pad=0.1, share_all=True)
for i, ax in enumerate(grid):
    ax.imshow(X_rp[i], cmap='binary', origin='lower')
grid[0].get_yaxis().set_ticks([])
grid[0].get_xaxis().set_ticks([])

fig.suptitle(
    "Recurrence plots for the 50 time series in the 'GunPoint' dataset",
    y=0.92
)

plt.show()
Total running time of the script: ( 0 minutes 1.278 seconds)
