Note
Click here to download the full example code
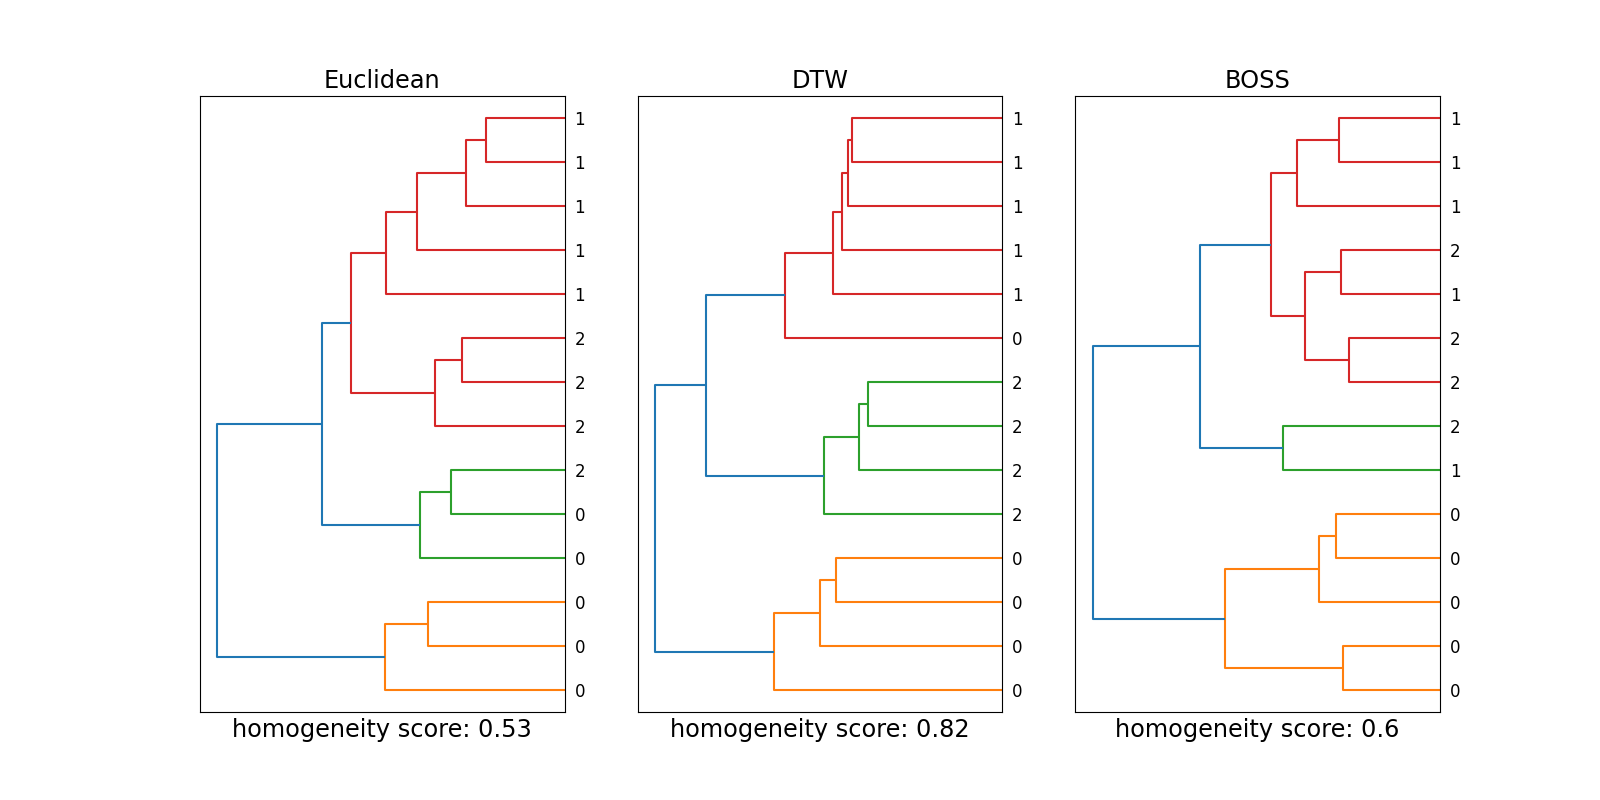
Time Series Clustering with DTW and BOSS
This example shows the differences between various metrics
related to time series clustering. Besides the Euclidean distance,
pyts.metrics.dtw() and pyts.metrics.boss() are considered to
analyze the pyts.datasets.make_cylinder_bell_funnel() dataset.
In contrast to reference [1], DTW-based clustering shows the best results
here. The reason for this could be differences in the experimental setup,
e.g., the hyperparameters of the methods or the number of considered samples.
Depending on the time series structure, a suitable metric should be chosen:
While the Euclidean distance and DTW are sensitive to time-dependent events,
clustering with BOSS does not consider the temporal component outside the
sliding window.
References
- [1] Patrick Schäfer, “The BOSS is concerned with time series classification
- in the presence of noise”. Data Mining and Knowledge Discovery, 29(6), 1505-1530 (2015).
/home/docs/checkouts/readthedocs.org/user_builds/pyts/envs/latest/lib/python3.12/site-packages/sklearn/utils/deprecation.py:132: FutureWarning: 'force_all_finite' was renamed to 'ensure_all_finite' in 1.6 and will be removed in 1.8.
  warnings.warn(
/home/docs/checkouts/readthedocs.org/user_builds/pyts/envs/latest/lib/python3.12/site-packages/sklearn/utils/deprecation.py:132: FutureWarning: 'force_all_finite' was renamed to 'ensure_all_finite' in 1.6 and will be removed in 1.8.
  warnings.warn(
/home/docs/checkouts/readthedocs.org/user_builds/pyts/envs/latest/lib/python3.12/site-packages/sklearn/utils/deprecation.py:132: FutureWarning: 'force_all_finite' was renamed to 'ensure_all_finite' in 1.6 and will be removed in 1.8.
  warnings.warn(
/home/docs/checkouts/readthedocs.org/user_builds/pyts/envs/latest/lib/python3.12/site-packages/sklearn/utils/deprecation.py:132: FutureWarning: 'force_all_finite' was renamed to 'ensure_all_finite' in 1.6 and will be removed in 1.8.
  warnings.warn(
/home/docs/checkouts/readthedocs.org/user_builds/pyts/envs/latest/lib/python3.12/site-packages/sklearn/utils/deprecation.py:132: FutureWarning: 'force_all_finite' was renamed to 'ensure_all_finite' in 1.6 and will be removed in 1.8.
  warnings.warn(
/home/docs/checkouts/readthedocs.org/user_builds/pyts/envs/latest/lib/python3.12/site-packages/sklearn/utils/deprecation.py:132: FutureWarning: 'force_all_finite' was renamed to 'ensure_all_finite' in 1.6 and will be removed in 1.8.
  warnings.warn(
/home/docs/checkouts/readthedocs.org/user_builds/pyts/envs/latest/lib/python3.12/site-packages/sklearn/utils/deprecation.py:132: FutureWarning: 'force_all_finite' was renamed to 'ensure_all_finite' in 1.6 and will be removed in 1.8.
  warnings.warn(
/home/docs/checkouts/readthedocs.org/user_builds/pyts/envs/latest/lib/python3.12/site-packages/sklearn/utils/deprecation.py:132: FutureWarning: 'force_all_finite' was renamed to 'ensure_all_finite' in 1.6 and will be removed in 1.8.
  warnings.warn(
/home/docs/checkouts/readthedocs.org/user_builds/pyts/envs/latest/lib/python3.12/site-packages/sklearn/utils/deprecation.py:132: FutureWarning: 'force_all_finite' was renamed to 'ensure_all_finite' in 1.6 and will be removed in 1.8.
  warnings.warn(
/home/docs/checkouts/readthedocs.org/user_builds/pyts/envs/latest/lib/python3.12/site-packages/sklearn/utils/deprecation.py:132: FutureWarning: 'force_all_finite' was renamed to 'ensure_all_finite' in 1.6 and will be removed in 1.8.
  warnings.warn(
/home/docs/checkouts/readthedocs.org/user_builds/pyts/envs/latest/lib/python3.12/site-packages/sklearn/utils/deprecation.py:132: FutureWarning: 'force_all_finite' was renamed to 'ensure_all_finite' in 1.6 and will be removed in 1.8.
  warnings.warn(
/home/docs/checkouts/readthedocs.org/user_builds/pyts/envs/latest/lib/python3.12/site-packages/sklearn/utils/deprecation.py:132: FutureWarning: 'force_all_finite' was renamed to 'ensure_all_finite' in 1.6 and will be removed in 1.8.
  warnings.warn(
/home/docs/checkouts/readthedocs.org/user_builds/pyts/envs/latest/lib/python3.12/site-packages/sklearn/utils/deprecation.py:132: FutureWarning: 'force_all_finite' was renamed to 'ensure_all_finite' in 1.6 and will be removed in 1.8.
  warnings.warn(
/home/docs/checkouts/readthedocs.org/user_builds/pyts/envs/latest/lib/python3.12/site-packages/sklearn/utils/deprecation.py:132: FutureWarning: 'force_all_finite' was renamed to 'ensure_all_finite' in 1.6 and will be removed in 1.8.
  warnings.warn(
/home/docs/checkouts/readthedocs.org/user_builds/pyts/envs/latest/lib/python3.12/site-packages/sklearn/utils/deprecation.py:132: FutureWarning: 'force_all_finite' was renamed to 'ensure_all_finite' in 1.6 and will be removed in 1.8.
  warnings.warn(
/home/docs/checkouts/readthedocs.org/user_builds/pyts/envs/latest/lib/python3.12/site-packages/sklearn/utils/deprecation.py:132: FutureWarning: 'force_all_finite' was renamed to 'ensure_all_finite' in 1.6 and will be removed in 1.8.
  warnings.warn(
/home/docs/checkouts/readthedocs.org/user_builds/pyts/envs/latest/lib/python3.12/site-packages/sklearn/utils/deprecation.py:132: FutureWarning: 'force_all_finite' was renamed to 'ensure_all_finite' in 1.6 and will be removed in 1.8.
  warnings.warn(
/home/docs/checkouts/readthedocs.org/user_builds/pyts/envs/latest/lib/python3.12/site-packages/sklearn/utils/deprecation.py:132: FutureWarning: 'force_all_finite' was renamed to 'ensure_all_finite' in 1.6 and will be removed in 1.8.
  warnings.warn(
/home/docs/checkouts/readthedocs.org/user_builds/pyts/envs/latest/lib/python3.12/site-packages/sklearn/utils/deprecation.py:132: FutureWarning: 'force_all_finite' was renamed to 'ensure_all_finite' in 1.6 and will be removed in 1.8.
  warnings.warn(
/home/docs/checkouts/readthedocs.org/user_builds/pyts/envs/latest/lib/python3.12/site-packages/sklearn/utils/deprecation.py:132: FutureWarning: 'force_all_finite' was renamed to 'ensure_all_finite' in 1.6 and will be removed in 1.8.
  warnings.warn(
/home/docs/checkouts/readthedocs.org/user_builds/pyts/envs/latest/lib/python3.12/site-packages/sklearn/utils/deprecation.py:132: FutureWarning: 'force_all_finite' was renamed to 'ensure_all_finite' in 1.6 and will be removed in 1.8.
  warnings.warn(
/home/docs/checkouts/readthedocs.org/user_builds/pyts/envs/latest/lib/python3.12/site-packages/sklearn/utils/deprecation.py:132: FutureWarning: 'force_all_finite' was renamed to 'ensure_all_finite' in 1.6 and will be removed in 1.8.
  warnings.warn(
/home/docs/checkouts/readthedocs.org/user_builds/pyts/envs/latest/lib/python3.12/site-packages/sklearn/utils/deprecation.py:132: FutureWarning: 'force_all_finite' was renamed to 'ensure_all_finite' in 1.6 and will be removed in 1.8.
  warnings.warn(
/home/docs/checkouts/readthedocs.org/user_builds/pyts/envs/latest/lib/python3.12/site-packages/sklearn/utils/deprecation.py:132: FutureWarning: 'force_all_finite' was renamed to 'ensure_all_finite' in 1.6 and will be removed in 1.8.
  warnings.warn(
/home/docs/checkouts/readthedocs.org/user_builds/pyts/envs/latest/lib/python3.12/site-packages/sklearn/utils/deprecation.py:132: FutureWarning: 'force_all_finite' was renamed to 'ensure_all_finite' in 1.6 and will be removed in 1.8.
  warnings.warn(
/home/docs/checkouts/readthedocs.org/user_builds/pyts/envs/latest/lib/python3.12/site-packages/sklearn/utils/deprecation.py:132: FutureWarning: 'force_all_finite' was renamed to 'ensure_all_finite' in 1.6 and will be removed in 1.8.
  warnings.warn(
/home/docs/checkouts/readthedocs.org/user_builds/pyts/envs/latest/lib/python3.12/site-packages/sklearn/utils/deprecation.py:132: FutureWarning: 'force_all_finite' was renamed to 'ensure_all_finite' in 1.6 and will be removed in 1.8.
  warnings.warn(
/home/docs/checkouts/readthedocs.org/user_builds/pyts/envs/latest/lib/python3.12/site-packages/sklearn/utils/deprecation.py:132: FutureWarning: 'force_all_finite' was renamed to 'ensure_all_finite' in 1.6 and will be removed in 1.8.
  warnings.warn(
/home/docs/checkouts/readthedocs.org/user_builds/pyts/envs/latest/lib/python3.12/site-packages/sklearn/utils/deprecation.py:132: FutureWarning: 'force_all_finite' was renamed to 'ensure_all_finite' in 1.6 and will be removed in 1.8.
  warnings.warn(
/home/docs/checkouts/readthedocs.org/user_builds/pyts/envs/latest/lib/python3.12/site-packages/sklearn/utils/deprecation.py:132: FutureWarning: 'force_all_finite' was renamed to 'ensure_all_finite' in 1.6 and will be removed in 1.8.
  warnings.warn(
/home/docs/checkouts/readthedocs.org/user_builds/pyts/envs/latest/lib/python3.12/site-packages/sklearn/utils/deprecation.py:132: FutureWarning: 'force_all_finite' was renamed to 'ensure_all_finite' in 1.6 and will be removed in 1.8.
  warnings.warn(
/home/docs/checkouts/readthedocs.org/user_builds/pyts/envs/latest/lib/python3.12/site-packages/sklearn/utils/deprecation.py:132: FutureWarning: 'force_all_finite' was renamed to 'ensure_all_finite' in 1.6 and will be removed in 1.8.
  warnings.warn(
/home/docs/checkouts/readthedocs.org/user_builds/pyts/envs/latest/lib/python3.12/site-packages/sklearn/utils/deprecation.py:132: FutureWarning: 'force_all_finite' was renamed to 'ensure_all_finite' in 1.6 and will be removed in 1.8.
  warnings.warn(
/home/docs/checkouts/readthedocs.org/user_builds/pyts/envs/latest/lib/python3.12/site-packages/sklearn/utils/deprecation.py:132: FutureWarning: 'force_all_finite' was renamed to 'ensure_all_finite' in 1.6 and will be removed in 1.8.
  warnings.warn(
/home/docs/checkouts/readthedocs.org/user_builds/pyts/envs/latest/lib/python3.12/site-packages/sklearn/utils/deprecation.py:132: FutureWarning: 'force_all_finite' was renamed to 'ensure_all_finite' in 1.6 and will be removed in 1.8.
  warnings.warn(
/home/docs/checkouts/readthedocs.org/user_builds/pyts/envs/latest/lib/python3.12/site-packages/sklearn/utils/deprecation.py:132: FutureWarning: 'force_all_finite' was renamed to 'ensure_all_finite' in 1.6 and will be removed in 1.8.
  warnings.warn(
/home/docs/checkouts/readthedocs.org/user_builds/pyts/envs/latest/lib/python3.12/site-packages/sklearn/utils/deprecation.py:132: FutureWarning: 'force_all_finite' was renamed to 'ensure_all_finite' in 1.6 and will be removed in 1.8.
  warnings.warn(
/home/docs/checkouts/readthedocs.org/user_builds/pyts/envs/latest/lib/python3.12/site-packages/sklearn/utils/deprecation.py:132: FutureWarning: 'force_all_finite' was renamed to 'ensure_all_finite' in 1.6 and will be removed in 1.8.
  warnings.warn(
/home/docs/checkouts/readthedocs.org/user_builds/pyts/envs/latest/lib/python3.12/site-packages/sklearn/utils/deprecation.py:132: FutureWarning: 'force_all_finite' was renamed to 'ensure_all_finite' in 1.6 and will be removed in 1.8.
  warnings.warn(
/home/docs/checkouts/readthedocs.org/user_builds/pyts/envs/latest/lib/python3.12/site-packages/sklearn/utils/deprecation.py:132: FutureWarning: 'force_all_finite' was renamed to 'ensure_all_finite' in 1.6 and will be removed in 1.8.
  warnings.warn(
/home/docs/checkouts/readthedocs.org/user_builds/pyts/envs/latest/lib/python3.12/site-packages/sklearn/utils/deprecation.py:132: FutureWarning: 'force_all_finite' was renamed to 'ensure_all_finite' in 1.6 and will be removed in 1.8.
  warnings.warn(
/home/docs/checkouts/readthedocs.org/user_builds/pyts/envs/latest/lib/python3.12/site-packages/sklearn/utils/deprecation.py:132: FutureWarning: 'force_all_finite' was renamed to 'ensure_all_finite' in 1.6 and will be removed in 1.8.
  warnings.warn(
/home/docs/checkouts/readthedocs.org/user_builds/pyts/envs/latest/lib/python3.12/site-packages/sklearn/utils/deprecation.py:132: FutureWarning: 'force_all_finite' was renamed to 'ensure_all_finite' in 1.6 and will be removed in 1.8.
  warnings.warn(
/home/docs/checkouts/readthedocs.org/user_builds/pyts/envs/latest/lib/python3.12/site-packages/sklearn/utils/deprecation.py:132: FutureWarning: 'force_all_finite' was renamed to 'ensure_all_finite' in 1.6 and will be removed in 1.8.
  warnings.warn(
/home/docs/checkouts/readthedocs.org/user_builds/pyts/envs/latest/lib/python3.12/site-packages/sklearn/utils/deprecation.py:132: FutureWarning: 'force_all_finite' was renamed to 'ensure_all_finite' in 1.6 and will be removed in 1.8.
  warnings.warn(
/home/docs/checkouts/readthedocs.org/user_builds/pyts/envs/latest/lib/python3.12/site-packages/sklearn/utils/deprecation.py:132: FutureWarning: 'force_all_finite' was renamed to 'ensure_all_finite' in 1.6 and will be removed in 1.8.
  warnings.warn(
/home/docs/checkouts/readthedocs.org/user_builds/pyts/envs/latest/lib/python3.12/site-packages/sklearn/utils/deprecation.py:132: FutureWarning: 'force_all_finite' was renamed to 'ensure_all_finite' in 1.6 and will be removed in 1.8.
  warnings.warn(
/home/docs/checkouts/readthedocs.org/user_builds/pyts/envs/latest/lib/python3.12/site-packages/sklearn/utils/deprecation.py:132: FutureWarning: 'force_all_finite' was renamed to 'ensure_all_finite' in 1.6 and will be removed in 1.8.
  warnings.warn(
/home/docs/checkouts/readthedocs.org/user_builds/pyts/envs/latest/lib/python3.12/site-packages/sklearn/utils/deprecation.py:132: FutureWarning: 'force_all_finite' was renamed to 'ensure_all_finite' in 1.6 and will be removed in 1.8.
  warnings.warn(
/home/docs/checkouts/readthedocs.org/user_builds/pyts/envs/latest/lib/python3.12/site-packages/sklearn/utils/deprecation.py:132: FutureWarning: 'force_all_finite' was renamed to 'ensure_all_finite' in 1.6 and will be removed in 1.8.
  warnings.warn(
/home/docs/checkouts/readthedocs.org/user_builds/pyts/envs/latest/lib/python3.12/site-packages/sklearn/utils/deprecation.py:132: FutureWarning: 'force_all_finite' was renamed to 'ensure_all_finite' in 1.6 and will be removed in 1.8.
  warnings.warn(
/home/docs/checkouts/readthedocs.org/user_builds/pyts/envs/latest/lib/python3.12/site-packages/sklearn/utils/deprecation.py:132: FutureWarning: 'force_all_finite' was renamed to 'ensure_all_finite' in 1.6 and will be removed in 1.8.
  warnings.warn(
/home/docs/checkouts/readthedocs.org/user_builds/pyts/envs/latest/lib/python3.12/site-packages/sklearn/utils/deprecation.py:132: FutureWarning: 'force_all_finite' was renamed to 'ensure_all_finite' in 1.6 and will be removed in 1.8.
  warnings.warn(
/home/docs/checkouts/readthedocs.org/user_builds/pyts/envs/latest/lib/python3.12/site-packages/sklearn/utils/deprecation.py:132: FutureWarning: 'force_all_finite' was renamed to 'ensure_all_finite' in 1.6 and will be removed in 1.8.
  warnings.warn(
/home/docs/checkouts/readthedocs.org/user_builds/pyts/envs/latest/lib/python3.12/site-packages/sklearn/utils/deprecation.py:132: FutureWarning: 'force_all_finite' was renamed to 'ensure_all_finite' in 1.6 and will be removed in 1.8.
  warnings.warn(
/home/docs/checkouts/readthedocs.org/user_builds/pyts/envs/latest/lib/python3.12/site-packages/sklearn/utils/deprecation.py:132: FutureWarning: 'force_all_finite' was renamed to 'ensure_all_finite' in 1.6 and will be removed in 1.8.
  warnings.warn(
/home/docs/checkouts/readthedocs.org/user_builds/pyts/envs/latest/lib/python3.12/site-packages/sklearn/utils/deprecation.py:132: FutureWarning: 'force_all_finite' was renamed to 'ensure_all_finite' in 1.6 and will be removed in 1.8.
  warnings.warn(
/home/docs/checkouts/readthedocs.org/user_builds/pyts/envs/latest/lib/python3.12/site-packages/sklearn/utils/deprecation.py:132: FutureWarning: 'force_all_finite' was renamed to 'ensure_all_finite' in 1.6 and will be removed in 1.8.
  warnings.warn(
/home/docs/checkouts/readthedocs.org/user_builds/pyts/envs/latest/lib/python3.12/site-packages/sklearn/utils/deprecation.py:132: FutureWarning: 'force_all_finite' was renamed to 'ensure_all_finite' in 1.6 and will be removed in 1.8.
  warnings.warn(
/home/docs/checkouts/readthedocs.org/user_builds/pyts/envs/latest/lib/python3.12/site-packages/sklearn/utils/deprecation.py:132: FutureWarning: 'force_all_finite' was renamed to 'ensure_all_finite' in 1.6 and will be removed in 1.8.
  warnings.warn(
/home/docs/checkouts/readthedocs.org/user_builds/pyts/envs/latest/lib/python3.12/site-packages/sklearn/utils/deprecation.py:132: FutureWarning: 'force_all_finite' was renamed to 'ensure_all_finite' in 1.6 and will be removed in 1.8.
  warnings.warn(
/home/docs/checkouts/readthedocs.org/user_builds/pyts/envs/latest/lib/python3.12/site-packages/sklearn/utils/deprecation.py:132: FutureWarning: 'force_all_finite' was renamed to 'ensure_all_finite' in 1.6 and will be removed in 1.8.
  warnings.warn(
/home/docs/checkouts/readthedocs.org/user_builds/pyts/envs/latest/lib/python3.12/site-packages/sklearn/utils/deprecation.py:132: FutureWarning: 'force_all_finite' was renamed to 'ensure_all_finite' in 1.6 and will be removed in 1.8.
  warnings.warn(
/home/docs/checkouts/readthedocs.org/user_builds/pyts/envs/latest/lib/python3.12/site-packages/sklearn/utils/deprecation.py:132: FutureWarning: 'force_all_finite' was renamed to 'ensure_all_finite' in 1.6 and will be removed in 1.8.
  warnings.warn(
/home/docs/checkouts/readthedocs.org/user_builds/pyts/envs/latest/lib/python3.12/site-packages/sklearn/utils/deprecation.py:132: FutureWarning: 'force_all_finite' was renamed to 'ensure_all_finite' in 1.6 and will be removed in 1.8.
  warnings.warn(
/home/docs/checkouts/readthedocs.org/user_builds/pyts/envs/latest/lib/python3.12/site-packages/sklearn/utils/deprecation.py:132: FutureWarning: 'force_all_finite' was renamed to 'ensure_all_finite' in 1.6 and will be removed in 1.8.
  warnings.warn(
/home/docs/checkouts/readthedocs.org/user_builds/pyts/envs/latest/lib/python3.12/site-packages/sklearn/utils/deprecation.py:132: FutureWarning: 'force_all_finite' was renamed to 'ensure_all_finite' in 1.6 and will be removed in 1.8.
  warnings.warn(
/home/docs/checkouts/readthedocs.org/user_builds/pyts/envs/latest/lib/python3.12/site-packages/sklearn/utils/deprecation.py:132: FutureWarning: 'force_all_finite' was renamed to 'ensure_all_finite' in 1.6 and will be removed in 1.8.
  warnings.warn(
/home/docs/checkouts/readthedocs.org/user_builds/pyts/envs/latest/lib/python3.12/site-packages/sklearn/utils/deprecation.py:132: FutureWarning: 'force_all_finite' was renamed to 'ensure_all_finite' in 1.6 and will be removed in 1.8.
  warnings.warn(
/home/docs/checkouts/readthedocs.org/user_builds/pyts/envs/latest/lib/python3.12/site-packages/sklearn/utils/deprecation.py:132: FutureWarning: 'force_all_finite' was renamed to 'ensure_all_finite' in 1.6 and will be removed in 1.8.
  warnings.warn(
/home/docs/checkouts/readthedocs.org/user_builds/pyts/envs/latest/lib/python3.12/site-packages/sklearn/utils/deprecation.py:132: FutureWarning: 'force_all_finite' was renamed to 'ensure_all_finite' in 1.6 and will be removed in 1.8.
  warnings.warn(
/home/docs/checkouts/readthedocs.org/user_builds/pyts/envs/latest/lib/python3.12/site-packages/sklearn/utils/deprecation.py:132: FutureWarning: 'force_all_finite' was renamed to 'ensure_all_finite' in 1.6 and will be removed in 1.8.
  warnings.warn(
/home/docs/checkouts/readthedocs.org/user_builds/pyts/envs/latest/lib/python3.12/site-packages/sklearn/utils/deprecation.py:132: FutureWarning: 'force_all_finite' was renamed to 'ensure_all_finite' in 1.6 and will be removed in 1.8.
  warnings.warn(
/home/docs/checkouts/readthedocs.org/user_builds/pyts/envs/latest/lib/python3.12/site-packages/sklearn/utils/deprecation.py:132: FutureWarning: 'force_all_finite' was renamed to 'ensure_all_finite' in 1.6 and will be removed in 1.8.
  warnings.warn(
/home/docs/checkouts/readthedocs.org/user_builds/pyts/envs/latest/lib/python3.12/site-packages/sklearn/utils/deprecation.py:132: FutureWarning: 'force_all_finite' was renamed to 'ensure_all_finite' in 1.6 and will be removed in 1.8.
  warnings.warn(
/home/docs/checkouts/readthedocs.org/user_builds/pyts/envs/latest/lib/python3.12/site-packages/sklearn/utils/deprecation.py:132: FutureWarning: 'force_all_finite' was renamed to 'ensure_all_finite' in 1.6 and will be removed in 1.8.
  warnings.warn(
/home/docs/checkouts/readthedocs.org/user_builds/pyts/envs/latest/lib/python3.12/site-packages/sklearn/utils/deprecation.py:132: FutureWarning: 'force_all_finite' was renamed to 'ensure_all_finite' in 1.6 and will be removed in 1.8.
  warnings.warn(
/home/docs/checkouts/readthedocs.org/user_builds/pyts/envs/latest/lib/python3.12/site-packages/sklearn/utils/deprecation.py:132: FutureWarning: 'force_all_finite' was renamed to 'ensure_all_finite' in 1.6 and will be removed in 1.8.
  warnings.warn(
/home/docs/checkouts/readthedocs.org/user_builds/pyts/envs/latest/lib/python3.12/site-packages/sklearn/utils/deprecation.py:132: FutureWarning: 'force_all_finite' was renamed to 'ensure_all_finite' in 1.6 and will be removed in 1.8.
  warnings.warn(
/home/docs/checkouts/readthedocs.org/user_builds/pyts/envs/latest/lib/python3.12/site-packages/sklearn/utils/deprecation.py:132: FutureWarning: 'force_all_finite' was renamed to 'ensure_all_finite' in 1.6 and will be removed in 1.8.
  warnings.warn(
/home/docs/checkouts/readthedocs.org/user_builds/pyts/envs/latest/lib/python3.12/site-packages/sklearn/utils/deprecation.py:132: FutureWarning: 'force_all_finite' was renamed to 'ensure_all_finite' in 1.6 and will be removed in 1.8.
  warnings.warn(
/home/docs/checkouts/readthedocs.org/user_builds/pyts/envs/latest/lib/python3.12/site-packages/sklearn/utils/deprecation.py:132: FutureWarning: 'force_all_finite' was renamed to 'ensure_all_finite' in 1.6 and will be removed in 1.8.
  warnings.warn(
/home/docs/checkouts/readthedocs.org/user_builds/pyts/envs/latest/lib/python3.12/site-packages/sklearn/utils/deprecation.py:132: FutureWarning: 'force_all_finite' was renamed to 'ensure_all_finite' in 1.6 and will be removed in 1.8.
  warnings.warn(
/home/docs/checkouts/readthedocs.org/user_builds/pyts/envs/latest/lib/python3.12/site-packages/sklearn/utils/deprecation.py:132: FutureWarning: 'force_all_finite' was renamed to 'ensure_all_finite' in 1.6 and will be removed in 1.8.
  warnings.warn(
/home/docs/checkouts/readthedocs.org/user_builds/pyts/envs/latest/lib/python3.12/site-packages/sklearn/utils/deprecation.py:132: FutureWarning: 'force_all_finite' was renamed to 'ensure_all_finite' in 1.6 and will be removed in 1.8.
  warnings.warn(
/home/docs/checkouts/readthedocs.org/user_builds/pyts/envs/latest/lib/python3.12/site-packages/sklearn/utils/deprecation.py:132: FutureWarning: 'force_all_finite' was renamed to 'ensure_all_finite' in 1.6 and will be removed in 1.8.
  warnings.warn(
/home/docs/checkouts/readthedocs.org/user_builds/pyts/envs/latest/lib/python3.12/site-packages/sklearn/utils/deprecation.py:132: FutureWarning: 'force_all_finite' was renamed to 'ensure_all_finite' in 1.6 and will be removed in 1.8.
  warnings.warn(
/home/docs/checkouts/readthedocs.org/user_builds/pyts/envs/latest/lib/python3.12/site-packages/sklearn/utils/deprecation.py:132: FutureWarning: 'force_all_finite' was renamed to 'ensure_all_finite' in 1.6 and will be removed in 1.8.
  warnings.warn(
/home/docs/checkouts/readthedocs.org/user_builds/pyts/envs/latest/lib/python3.12/site-packages/sklearn/utils/deprecation.py:132: FutureWarning: 'force_all_finite' was renamed to 'ensure_all_finite' in 1.6 and will be removed in 1.8.
  warnings.warn(
/home/docs/checkouts/readthedocs.org/user_builds/pyts/envs/latest/lib/python3.12/site-packages/sklearn/utils/deprecation.py:132: FutureWarning: 'force_all_finite' was renamed to 'ensure_all_finite' in 1.6 and will be removed in 1.8.
  warnings.warn(
/home/docs/checkouts/readthedocs.org/user_builds/pyts/envs/latest/lib/python3.12/site-packages/sklearn/utils/deprecation.py:132: FutureWarning: 'force_all_finite' was renamed to 'ensure_all_finite' in 1.6 and will be removed in 1.8.
  warnings.warn(
/home/docs/checkouts/readthedocs.org/user_builds/pyts/envs/latest/lib/python3.12/site-packages/sklearn/utils/deprecation.py:132: FutureWarning: 'force_all_finite' was renamed to 'ensure_all_finite' in 1.6 and will be removed in 1.8.
  warnings.warn(
/home/docs/checkouts/readthedocs.org/user_builds/pyts/envs/latest/lib/python3.12/site-packages/sklearn/utils/deprecation.py:132: FutureWarning: 'force_all_finite' was renamed to 'ensure_all_finite' in 1.6 and will be removed in 1.8.
  warnings.warn(
/home/docs/checkouts/readthedocs.org/user_builds/pyts/envs/latest/lib/python3.12/site-packages/sklearn/utils/deprecation.py:132: FutureWarning: 'force_all_finite' was renamed to 'ensure_all_finite' in 1.6 and will be removed in 1.8.
  warnings.warn(
/home/docs/checkouts/readthedocs.org/user_builds/pyts/envs/latest/lib/python3.12/site-packages/sklearn/utils/deprecation.py:132: FutureWarning: 'force_all_finite' was renamed to 'ensure_all_finite' in 1.6 and will be removed in 1.8.
  warnings.warn(
/home/docs/checkouts/readthedocs.org/user_builds/pyts/envs/latest/lib/python3.12/site-packages/sklearn/utils/deprecation.py:132: FutureWarning: 'force_all_finite' was renamed to 'ensure_all_finite' in 1.6 and will be removed in 1.8.
  warnings.warn(
/home/docs/checkouts/readthedocs.org/user_builds/pyts/envs/latest/lib/python3.12/site-packages/sklearn/utils/deprecation.py:132: FutureWarning: 'force_all_finite' was renamed to 'ensure_all_finite' in 1.6 and will be removed in 1.8.
  warnings.warn(
/home/docs/checkouts/readthedocs.org/user_builds/pyts/envs/latest/lib/python3.12/site-packages/sklearn/utils/deprecation.py:132: FutureWarning: 'force_all_finite' was renamed to 'ensure_all_finite' in 1.6 and will be removed in 1.8.
  warnings.warn(
/home/docs/checkouts/readthedocs.org/user_builds/pyts/envs/latest/lib/python3.12/site-packages/sklearn/utils/deprecation.py:132: FutureWarning: 'force_all_finite' was renamed to 'ensure_all_finite' in 1.6 and will be removed in 1.8.
  warnings.warn(
/home/docs/checkouts/readthedocs.org/user_builds/pyts/envs/latest/lib/python3.12/site-packages/sklearn/utils/deprecation.py:132: FutureWarning: 'force_all_finite' was renamed to 'ensure_all_finite' in 1.6 and will be removed in 1.8.
  warnings.warn(
/home/docs/checkouts/readthedocs.org/user_builds/pyts/envs/latest/lib/python3.12/site-packages/sklearn/utils/deprecation.py:132: FutureWarning: 'force_all_finite' was renamed to 'ensure_all_finite' in 1.6 and will be removed in 1.8.
  warnings.warn(
/home/docs/checkouts/readthedocs.org/user_builds/pyts/envs/latest/lib/python3.12/site-packages/sklearn/utils/deprecation.py:132: FutureWarning: 'force_all_finite' was renamed to 'ensure_all_finite' in 1.6 and will be removed in 1.8.
  warnings.warn(
/home/docs/checkouts/readthedocs.org/user_builds/pyts/envs/latest/lib/python3.12/site-packages/sklearn/utils/deprecation.py:132: FutureWarning: 'force_all_finite' was renamed to 'ensure_all_finite' in 1.6 and will be removed in 1.8.
  warnings.warn(
/home/docs/checkouts/readthedocs.org/user_builds/pyts/envs/latest/lib/python3.12/site-packages/sklearn/utils/deprecation.py:132: FutureWarning: 'force_all_finite' was renamed to 'ensure_all_finite' in 1.6 and will be removed in 1.8.
  warnings.warn(
/home/docs/checkouts/readthedocs.org/user_builds/pyts/envs/latest/lib/python3.12/site-packages/sklearn/utils/deprecation.py:132: FutureWarning: 'force_all_finite' was renamed to 'ensure_all_finite' in 1.6 and will be removed in 1.8.
  warnings.warn(
/home/docs/checkouts/readthedocs.org/user_builds/pyts/envs/latest/lib/python3.12/site-packages/sklearn/utils/deprecation.py:132: FutureWarning: 'force_all_finite' was renamed to 'ensure_all_finite' in 1.6 and will be removed in 1.8.
  warnings.warn(
/home/docs/checkouts/readthedocs.org/user_builds/pyts/envs/latest/lib/python3.12/site-packages/sklearn/utils/deprecation.py:132: FutureWarning: 'force_all_finite' was renamed to 'ensure_all_finite' in 1.6 and will be removed in 1.8.
  warnings.warn(
/home/docs/checkouts/readthedocs.org/user_builds/pyts/envs/latest/lib/python3.12/site-packages/sklearn/utils/deprecation.py:132: FutureWarning: 'force_all_finite' was renamed to 'ensure_all_finite' in 1.6 and will be removed in 1.8.
  warnings.warn(
/home/docs/checkouts/readthedocs.org/user_builds/pyts/envs/latest/lib/python3.12/site-packages/sklearn/utils/deprecation.py:132: FutureWarning: 'force_all_finite' was renamed to 'ensure_all_finite' in 1.6 and will be removed in 1.8.
  warnings.warn(
/home/docs/checkouts/readthedocs.org/user_builds/pyts/envs/latest/lib/python3.12/site-packages/sklearn/utils/deprecation.py:132: FutureWarning: 'force_all_finite' was renamed to 'ensure_all_finite' in 1.6 and will be removed in 1.8.
  warnings.warn(
/home/docs/checkouts/readthedocs.org/user_builds/pyts/envs/latest/lib/python3.12/site-packages/sklearn/utils/deprecation.py:132: FutureWarning: 'force_all_finite' was renamed to 'ensure_all_finite' in 1.6 and will be removed in 1.8.
  warnings.warn(
/home/docs/checkouts/readthedocs.org/user_builds/pyts/envs/latest/lib/python3.12/site-packages/sklearn/utils/deprecation.py:132: FutureWarning: 'force_all_finite' was renamed to 'ensure_all_finite' in 1.6 and will be removed in 1.8.
  warnings.warn(
/home/docs/checkouts/readthedocs.org/user_builds/pyts/envs/latest/lib/python3.12/site-packages/sklearn/utils/deprecation.py:132: FutureWarning: 'force_all_finite' was renamed to 'ensure_all_finite' in 1.6 and will be removed in 1.8.
  warnings.warn(
/home/docs/checkouts/readthedocs.org/user_builds/pyts/envs/latest/lib/python3.12/site-packages/sklearn/utils/deprecation.py:132: FutureWarning: 'force_all_finite' was renamed to 'ensure_all_finite' in 1.6 and will be removed in 1.8.
  warnings.warn(
/home/docs/checkouts/readthedocs.org/user_builds/pyts/envs/latest/lib/python3.12/site-packages/sklearn/utils/deprecation.py:132: FutureWarning: 'force_all_finite' was renamed to 'ensure_all_finite' in 1.6 and will be removed in 1.8.
  warnings.warn(
/home/docs/checkouts/readthedocs.org/user_builds/pyts/envs/latest/lib/python3.12/site-packages/sklearn/utils/deprecation.py:132: FutureWarning: 'force_all_finite' was renamed to 'ensure_all_finite' in 1.6 and will be removed in 1.8.
  warnings.warn(
/home/docs/checkouts/readthedocs.org/user_builds/pyts/envs/latest/lib/python3.12/site-packages/sklearn/utils/deprecation.py:132: FutureWarning: 'force_all_finite' was renamed to 'ensure_all_finite' in 1.6 and will be removed in 1.8.
  warnings.warn(
/home/docs/checkouts/readthedocs.org/user_builds/pyts/envs/latest/lib/python3.12/site-packages/sklearn/utils/deprecation.py:132: FutureWarning: 'force_all_finite' was renamed to 'ensure_all_finite' in 1.6 and will be removed in 1.8.
  warnings.warn(
/home/docs/checkouts/readthedocs.org/user_builds/pyts/envs/latest/lib/python3.12/site-packages/sklearn/utils/deprecation.py:132: FutureWarning: 'force_all_finite' was renamed to 'ensure_all_finite' in 1.6 and will be removed in 1.8.
  warnings.warn(
/home/docs/checkouts/readthedocs.org/user_builds/pyts/envs/latest/lib/python3.12/site-packages/sklearn/utils/deprecation.py:132: FutureWarning: 'force_all_finite' was renamed to 'ensure_all_finite' in 1.6 and will be removed in 1.8.
  warnings.warn(
/home/docs/checkouts/readthedocs.org/user_builds/pyts/envs/latest/lib/python3.12/site-packages/sklearn/utils/deprecation.py:132: FutureWarning: 'force_all_finite' was renamed to 'ensure_all_finite' in 1.6 and will be removed in 1.8.
  warnings.warn(
/home/docs/checkouts/readthedocs.org/user_builds/pyts/envs/latest/lib/python3.12/site-packages/sklearn/utils/deprecation.py:132: FutureWarning: 'force_all_finite' was renamed to 'ensure_all_finite' in 1.6 and will be removed in 1.8.
  warnings.warn(
/home/docs/checkouts/readthedocs.org/user_builds/pyts/envs/latest/lib/python3.12/site-packages/sklearn/utils/deprecation.py:132: FutureWarning: 'force_all_finite' was renamed to 'ensure_all_finite' in 1.6 and will be removed in 1.8.
  warnings.warn(
/home/docs/checkouts/readthedocs.org/user_builds/pyts/envs/latest/lib/python3.12/site-packages/sklearn/utils/deprecation.py:132: FutureWarning: 'force_all_finite' was renamed to 'ensure_all_finite' in 1.6 and will be removed in 1.8.
  warnings.warn(
/home/docs/checkouts/readthedocs.org/user_builds/pyts/envs/latest/lib/python3.12/site-packages/sklearn/utils/deprecation.py:132: FutureWarning: 'force_all_finite' was renamed to 'ensure_all_finite' in 1.6 and will be removed in 1.8.
  warnings.warn(
/home/docs/checkouts/readthedocs.org/user_builds/pyts/envs/latest/lib/python3.12/site-packages/sklearn/utils/deprecation.py:132: FutureWarning: 'force_all_finite' was renamed to 'ensure_all_finite' in 1.6 and will be removed in 1.8.
  warnings.warn(
/home/docs/checkouts/readthedocs.org/user_builds/pyts/envs/latest/lib/python3.12/site-packages/sklearn/utils/deprecation.py:132: FutureWarning: 'force_all_finite' was renamed to 'ensure_all_finite' in 1.6 and will be removed in 1.8.
  warnings.warn(
/home/docs/checkouts/readthedocs.org/user_builds/pyts/envs/latest/lib/python3.12/site-packages/sklearn/utils/deprecation.py:132: FutureWarning: 'force_all_finite' was renamed to 'ensure_all_finite' in 1.6 and will be removed in 1.8.
  warnings.warn(
/home/docs/checkouts/readthedocs.org/user_builds/pyts/envs/latest/lib/python3.12/site-packages/sklearn/utils/deprecation.py:132: FutureWarning: 'force_all_finite' was renamed to 'ensure_all_finite' in 1.6 and will be removed in 1.8.
  warnings.warn(
/home/docs/checkouts/readthedocs.org/user_builds/pyts/envs/latest/lib/python3.12/site-packages/sklearn/utils/deprecation.py:132: FutureWarning: 'force_all_finite' was renamed to 'ensure_all_finite' in 1.6 and will be removed in 1.8.
  warnings.warn(
/home/docs/checkouts/readthedocs.org/user_builds/pyts/envs/latest/lib/python3.12/site-packages/sklearn/utils/deprecation.py:132: FutureWarning: 'force_all_finite' was renamed to 'ensure_all_finite' in 1.6 and will be removed in 1.8.
  warnings.warn(
/home/docs/checkouts/readthedocs.org/user_builds/pyts/envs/latest/lib/python3.12/site-packages/sklearn/utils/deprecation.py:132: FutureWarning: 'force_all_finite' was renamed to 'ensure_all_finite' in 1.6 and will be removed in 1.8.
  warnings.warn(
/home/docs/checkouts/readthedocs.org/user_builds/pyts/envs/latest/lib/python3.12/site-packages/sklearn/utils/deprecation.py:132: FutureWarning: 'force_all_finite' was renamed to 'ensure_all_finite' in 1.6 and will be removed in 1.8.
  warnings.warn(
/home/docs/checkouts/readthedocs.org/user_builds/pyts/envs/latest/lib/python3.12/site-packages/sklearn/utils/deprecation.py:132: FutureWarning: 'force_all_finite' was renamed to 'ensure_all_finite' in 1.6 and will be removed in 1.8.
  warnings.warn(
/home/docs/checkouts/readthedocs.org/user_builds/pyts/envs/latest/lib/python3.12/site-packages/sklearn/utils/deprecation.py:132: FutureWarning: 'force_all_finite' was renamed to 'ensure_all_finite' in 1.6 and will be removed in 1.8.
  warnings.warn(
/home/docs/checkouts/readthedocs.org/user_builds/pyts/envs/latest/lib/python3.12/site-packages/sklearn/utils/deprecation.py:132: FutureWarning: 'force_all_finite' was renamed to 'ensure_all_finite' in 1.6 and will be removed in 1.8.
  warnings.warn(
/home/docs/checkouts/readthedocs.org/user_builds/pyts/envs/latest/lib/python3.12/site-packages/sklearn/utils/deprecation.py:132: FutureWarning: 'force_all_finite' was renamed to 'ensure_all_finite' in 1.6 and will be removed in 1.8.
  warnings.warn(
/home/docs/checkouts/readthedocs.org/user_builds/pyts/envs/latest/lib/python3.12/site-packages/sklearn/utils/deprecation.py:132: FutureWarning: 'force_all_finite' was renamed to 'ensure_all_finite' in 1.6 and will be removed in 1.8.
  warnings.warn(
/home/docs/checkouts/readthedocs.org/user_builds/pyts/envs/latest/lib/python3.12/site-packages/sklearn/utils/deprecation.py:132: FutureWarning: 'force_all_finite' was renamed to 'ensure_all_finite' in 1.6 and will be removed in 1.8.
  warnings.warn(
/home/docs/checkouts/readthedocs.org/user_builds/pyts/envs/latest/lib/python3.12/site-packages/sklearn/utils/deprecation.py:132: FutureWarning: 'force_all_finite' was renamed to 'ensure_all_finite' in 1.6 and will be removed in 1.8.
  warnings.warn(
/home/docs/checkouts/readthedocs.org/user_builds/pyts/envs/latest/lib/python3.12/site-packages/sklearn/utils/deprecation.py:132: FutureWarning: 'force_all_finite' was renamed to 'ensure_all_finite' in 1.6 and will be removed in 1.8.
  warnings.warn(
/home/docs/checkouts/readthedocs.org/user_builds/pyts/envs/latest/lib/python3.12/site-packages/sklearn/utils/deprecation.py:132: FutureWarning: 'force_all_finite' was renamed to 'ensure_all_finite' in 1.6 and will be removed in 1.8.
  warnings.warn(
/home/docs/checkouts/readthedocs.org/user_builds/pyts/envs/latest/lib/python3.12/site-packages/sklearn/utils/deprecation.py:132: FutureWarning: 'force_all_finite' was renamed to 'ensure_all_finite' in 1.6 and will be removed in 1.8.
  warnings.warn(
/home/docs/checkouts/readthedocs.org/user_builds/pyts/envs/latest/lib/python3.12/site-packages/sklearn/utils/deprecation.py:132: FutureWarning: 'force_all_finite' was renamed to 'ensure_all_finite' in 1.6 and will be removed in 1.8.
  warnings.warn(
/home/docs/checkouts/readthedocs.org/user_builds/pyts/envs/latest/lib/python3.12/site-packages/sklearn/utils/deprecation.py:132: FutureWarning: 'force_all_finite' was renamed to 'ensure_all_finite' in 1.6 and will be removed in 1.8.
  warnings.warn(
/home/docs/checkouts/readthedocs.org/user_builds/pyts/envs/latest/lib/python3.12/site-packages/sklearn/utils/deprecation.py:132: FutureWarning: 'force_all_finite' was renamed to 'ensure_all_finite' in 1.6 and will be removed in 1.8.
  warnings.warn(
/home/docs/checkouts/readthedocs.org/user_builds/pyts/envs/latest/lib/python3.12/site-packages/sklearn/utils/deprecation.py:132: FutureWarning: 'force_all_finite' was renamed to 'ensure_all_finite' in 1.6 and will be removed in 1.8.
  warnings.warn(
/home/docs/checkouts/readthedocs.org/user_builds/pyts/envs/latest/lib/python3.12/site-packages/sklearn/utils/deprecation.py:132: FutureWarning: 'force_all_finite' was renamed to 'ensure_all_finite' in 1.6 and will be removed in 1.8.
  warnings.warn(
/home/docs/checkouts/readthedocs.org/user_builds/pyts/envs/latest/lib/python3.12/site-packages/sklearn/utils/deprecation.py:132: FutureWarning: 'force_all_finite' was renamed to 'ensure_all_finite' in 1.6 and will be removed in 1.8.
  warnings.warn(
/home/docs/checkouts/readthedocs.org/user_builds/pyts/envs/latest/lib/python3.12/site-packages/sklearn/utils/deprecation.py:132: FutureWarning: 'force_all_finite' was renamed to 'ensure_all_finite' in 1.6 and will be removed in 1.8.
  warnings.warn(
/home/docs/checkouts/readthedocs.org/user_builds/pyts/envs/latest/lib/python3.12/site-packages/sklearn/utils/deprecation.py:132: FutureWarning: 'force_all_finite' was renamed to 'ensure_all_finite' in 1.6 and will be removed in 1.8.
  warnings.warn(
/home/docs/checkouts/readthedocs.org/user_builds/pyts/envs/latest/lib/python3.12/site-packages/sklearn/utils/deprecation.py:132: FutureWarning: 'force_all_finite' was renamed to 'ensure_all_finite' in 1.6 and will be removed in 1.8.
  warnings.warn(
/home/docs/checkouts/readthedocs.org/user_builds/pyts/envs/latest/lib/python3.12/site-packages/sklearn/utils/deprecation.py:132: FutureWarning: 'force_all_finite' was renamed to 'ensure_all_finite' in 1.6 and will be removed in 1.8.
  warnings.warn(
/home/docs/checkouts/readthedocs.org/user_builds/pyts/envs/latest/lib/python3.12/site-packages/sklearn/utils/deprecation.py:132: FutureWarning: 'force_all_finite' was renamed to 'ensure_all_finite' in 1.6 and will be removed in 1.8.
  warnings.warn(
/home/docs/checkouts/readthedocs.org/user_builds/pyts/envs/latest/lib/python3.12/site-packages/sklearn/utils/deprecation.py:132: FutureWarning: 'force_all_finite' was renamed to 'ensure_all_finite' in 1.6 and will be removed in 1.8.
  warnings.warn(
/home/docs/checkouts/readthedocs.org/user_builds/pyts/envs/latest/lib/python3.12/site-packages/sklearn/utils/deprecation.py:132: FutureWarning: 'force_all_finite' was renamed to 'ensure_all_finite' in 1.6 and will be removed in 1.8.
  warnings.warn(
/home/docs/checkouts/readthedocs.org/user_builds/pyts/envs/latest/lib/python3.12/site-packages/sklearn/utils/deprecation.py:132: FutureWarning: 'force_all_finite' was renamed to 'ensure_all_finite' in 1.6 and will be removed in 1.8.
  warnings.warn(
/home/docs/checkouts/readthedocs.org/user_builds/pyts/envs/latest/lib/python3.12/site-packages/sklearn/utils/deprecation.py:132: FutureWarning: 'force_all_finite' was renamed to 'ensure_all_finite' in 1.6 and will be removed in 1.8.
  warnings.warn(
/home/docs/checkouts/readthedocs.org/user_builds/pyts/envs/latest/lib/python3.12/site-packages/sklearn/utils/deprecation.py:132: FutureWarning: 'force_all_finite' was renamed to 'ensure_all_finite' in 1.6 and will be removed in 1.8.
  warnings.warn(
/home/docs/checkouts/readthedocs.org/user_builds/pyts/envs/latest/lib/python3.12/site-packages/sklearn/utils/deprecation.py:132: FutureWarning: 'force_all_finite' was renamed to 'ensure_all_finite' in 1.6 and will be removed in 1.8.
  warnings.warn(
/home/docs/checkouts/readthedocs.org/user_builds/pyts/envs/latest/lib/python3.12/site-packages/sklearn/utils/deprecation.py:132: FutureWarning: 'force_all_finite' was renamed to 'ensure_all_finite' in 1.6 and will be removed in 1.8.
  warnings.warn(
/home/docs/checkouts/readthedocs.org/user_builds/pyts/envs/latest/lib/python3.12/site-packages/sklearn/utils/deprecation.py:132: FutureWarning: 'force_all_finite' was renamed to 'ensure_all_finite' in 1.6 and will be removed in 1.8.
  warnings.warn(
/home/docs/checkouts/readthedocs.org/user_builds/pyts/envs/latest/lib/python3.12/site-packages/sklearn/utils/deprecation.py:132: FutureWarning: 'force_all_finite' was renamed to 'ensure_all_finite' in 1.6 and will be removed in 1.8.
  warnings.warn(
/home/docs/checkouts/readthedocs.org/user_builds/pyts/envs/latest/lib/python3.12/site-packages/sklearn/utils/deprecation.py:132: FutureWarning: 'force_all_finite' was renamed to 'ensure_all_finite' in 1.6 and will be removed in 1.8.
  warnings.warn(
/home/docs/checkouts/readthedocs.org/user_builds/pyts/envs/latest/lib/python3.12/site-packages/sklearn/utils/deprecation.py:132: FutureWarning: 'force_all_finite' was renamed to 'ensure_all_finite' in 1.6 and will be removed in 1.8.
  warnings.warn(
/home/docs/checkouts/readthedocs.org/user_builds/pyts/envs/latest/lib/python3.12/site-packages/sklearn/utils/deprecation.py:132: FutureWarning: 'force_all_finite' was renamed to 'ensure_all_finite' in 1.6 and will be removed in 1.8.
  warnings.warn(
/home/docs/checkouts/readthedocs.org/user_builds/pyts/envs/latest/lib/python3.12/site-packages/sklearn/utils/deprecation.py:132: FutureWarning: 'force_all_finite' was renamed to 'ensure_all_finite' in 1.6 and will be removed in 1.8.
  warnings.warn(
/home/docs/checkouts/readthedocs.org/user_builds/pyts/envs/latest/lib/python3.12/site-packages/sklearn/utils/deprecation.py:132: FutureWarning: 'force_all_finite' was renamed to 'ensure_all_finite' in 1.6 and will be removed in 1.8.
  warnings.warn(
/home/docs/checkouts/readthedocs.org/user_builds/pyts/envs/latest/lib/python3.12/site-packages/sklearn/utils/deprecation.py:132: FutureWarning: 'force_all_finite' was renamed to 'ensure_all_finite' in 1.6 and will be removed in 1.8.
  warnings.warn(
/home/docs/checkouts/readthedocs.org/user_builds/pyts/envs/latest/lib/python3.12/site-packages/sklearn/utils/deprecation.py:132: FutureWarning: 'force_all_finite' was renamed to 'ensure_all_finite' in 1.6 and will be removed in 1.8.
  warnings.warn(
/home/docs/checkouts/readthedocs.org/user_builds/pyts/envs/latest/lib/python3.12/site-packages/sklearn/utils/deprecation.py:132: FutureWarning: 'force_all_finite' was renamed to 'ensure_all_finite' in 1.6 and will be removed in 1.8.
  warnings.warn(
/home/docs/checkouts/readthedocs.org/user_builds/pyts/envs/latest/lib/python3.12/site-packages/sklearn/utils/deprecation.py:132: FutureWarning: 'force_all_finite' was renamed to 'ensure_all_finite' in 1.6 and will be removed in 1.8.
  warnings.warn(
/home/docs/checkouts/readthedocs.org/user_builds/pyts/envs/latest/lib/python3.12/site-packages/sklearn/utils/deprecation.py:132: FutureWarning: 'force_all_finite' was renamed to 'ensure_all_finite' in 1.6 and will be removed in 1.8.
  warnings.warn(
/home/docs/checkouts/readthedocs.org/user_builds/pyts/envs/latest/lib/python3.12/site-packages/sklearn/utils/deprecation.py:132: FutureWarning: 'force_all_finite' was renamed to 'ensure_all_finite' in 1.6 and will be removed in 1.8.
  warnings.warn(
/home/docs/checkouts/readthedocs.org/user_builds/pyts/envs/latest/lib/python3.12/site-packages/sklearn/utils/deprecation.py:132: FutureWarning: 'force_all_finite' was renamed to 'ensure_all_finite' in 1.6 and will be removed in 1.8.
  warnings.warn(
/home/docs/checkouts/readthedocs.org/user_builds/pyts/envs/latest/lib/python3.12/site-packages/sklearn/utils/deprecation.py:132: FutureWarning: 'force_all_finite' was renamed to 'ensure_all_finite' in 1.6 and will be removed in 1.8.
  warnings.warn(
/home/docs/checkouts/readthedocs.org/user_builds/pyts/envs/latest/lib/python3.12/site-packages/sklearn/utils/deprecation.py:132: FutureWarning: 'force_all_finite' was renamed to 'ensure_all_finite' in 1.6 and will be removed in 1.8.
  warnings.warn(
/home/docs/checkouts/readthedocs.org/user_builds/pyts/envs/latest/lib/python3.12/site-packages/sklearn/utils/deprecation.py:132: FutureWarning: 'force_all_finite' was renamed to 'ensure_all_finite' in 1.6 and will be removed in 1.8.
  warnings.warn(
/home/docs/checkouts/readthedocs.org/user_builds/pyts/envs/latest/lib/python3.12/site-packages/sklearn/utils/deprecation.py:132: FutureWarning: 'force_all_finite' was renamed to 'ensure_all_finite' in 1.6 and will be removed in 1.8.
  warnings.warn(
/home/docs/checkouts/readthedocs.org/user_builds/pyts/envs/latest/lib/python3.12/site-packages/sklearn/utils/deprecation.py:132: FutureWarning: 'force_all_finite' was renamed to 'ensure_all_finite' in 1.6 and will be removed in 1.8.
  warnings.warn(
/home/docs/checkouts/readthedocs.org/user_builds/pyts/envs/latest/lib/python3.12/site-packages/sklearn/utils/deprecation.py:132: FutureWarning: 'force_all_finite' was renamed to 'ensure_all_finite' in 1.6 and will be removed in 1.8.
  warnings.warn(
/home/docs/checkouts/readthedocs.org/user_builds/pyts/envs/latest/lib/python3.12/site-packages/sklearn/utils/deprecation.py:132: FutureWarning: 'force_all_finite' was renamed to 'ensure_all_finite' in 1.6 and will be removed in 1.8.
  warnings.warn(
/home/docs/checkouts/readthedocs.org/user_builds/pyts/envs/latest/lib/python3.12/site-packages/sklearn/utils/deprecation.py:132: FutureWarning: 'force_all_finite' was renamed to 'ensure_all_finite' in 1.6 and will be removed in 1.8.
  warnings.warn(
/home/docs/checkouts/readthedocs.org/user_builds/pyts/envs/latest/lib/python3.12/site-packages/sklearn/utils/deprecation.py:132: FutureWarning: 'force_all_finite' was renamed to 'ensure_all_finite' in 1.6 and will be removed in 1.8.
  warnings.warn(
/home/docs/checkouts/readthedocs.org/user_builds/pyts/envs/latest/lib/python3.12/site-packages/sklearn/utils/deprecation.py:132: FutureWarning: 'force_all_finite' was renamed to 'ensure_all_finite' in 1.6 and will be removed in 1.8.
  warnings.warn(
/home/docs/checkouts/readthedocs.org/user_builds/pyts/envs/latest/lib/python3.12/site-packages/sklearn/utils/deprecation.py:132: FutureWarning: 'force_all_finite' was renamed to 'ensure_all_finite' in 1.6 and will be removed in 1.8.
  warnings.warn(
/home/docs/checkouts/readthedocs.org/user_builds/pyts/envs/latest/lib/python3.12/site-packages/sklearn/utils/deprecation.py:132: FutureWarning: 'force_all_finite' was renamed to 'ensure_all_finite' in 1.6 and will be removed in 1.8.
  warnings.warn(
/home/docs/checkouts/readthedocs.org/user_builds/pyts/envs/latest/lib/python3.12/site-packages/sklearn/utils/deprecation.py:132: FutureWarning: 'force_all_finite' was renamed to 'ensure_all_finite' in 1.6 and will be removed in 1.8.
  warnings.warn(
/home/docs/checkouts/readthedocs.org/user_builds/pyts/envs/latest/lib/python3.12/site-packages/sklearn/utils/deprecation.py:132: FutureWarning: 'force_all_finite' was renamed to 'ensure_all_finite' in 1.6 and will be removed in 1.8.
  warnings.warn(
/home/docs/checkouts/readthedocs.org/user_builds/pyts/envs/latest/lib/python3.12/site-packages/sklearn/utils/deprecation.py:132: FutureWarning: 'force_all_finite' was renamed to 'ensure_all_finite' in 1.6 and will be removed in 1.8.
  warnings.warn(
/home/docs/checkouts/readthedocs.org/user_builds/pyts/envs/latest/lib/python3.12/site-packages/sklearn/utils/deprecation.py:132: FutureWarning: 'force_all_finite' was renamed to 'ensure_all_finite' in 1.6 and will be removed in 1.8.
  warnings.warn(
/home/docs/checkouts/readthedocs.org/user_builds/pyts/envs/latest/lib/python3.12/site-packages/sklearn/utils/deprecation.py:132: FutureWarning: 'force_all_finite' was renamed to 'ensure_all_finite' in 1.6 and will be removed in 1.8.
  warnings.warn(
/home/docs/checkouts/readthedocs.org/user_builds/pyts/envs/latest/lib/python3.12/site-packages/sklearn/utils/deprecation.py:132: FutureWarning: 'force_all_finite' was renamed to 'ensure_all_finite' in 1.6 and will be removed in 1.8.
  warnings.warn(
/home/docs/checkouts/readthedocs.org/user_builds/pyts/envs/latest/lib/python3.12/site-packages/sklearn/utils/deprecation.py:132: FutureWarning: 'force_all_finite' was renamed to 'ensure_all_finite' in 1.6 and will be removed in 1.8.
  warnings.warn(
/home/docs/checkouts/readthedocs.org/user_builds/pyts/envs/latest/lib/python3.12/site-packages/sklearn/utils/deprecation.py:132: FutureWarning: 'force_all_finite' was renamed to 'ensure_all_finite' in 1.6 and will be removed in 1.8.
  warnings.warn(
/home/docs/checkouts/readthedocs.org/user_builds/pyts/envs/latest/lib/python3.12/site-packages/sklearn/utils/deprecation.py:132: FutureWarning: 'force_all_finite' was renamed to 'ensure_all_finite' in 1.6 and will be removed in 1.8.
  warnings.warn(
/home/docs/checkouts/readthedocs.org/user_builds/pyts/envs/latest/lib/python3.12/site-packages/sklearn/utils/deprecation.py:132: FutureWarning: 'force_all_finite' was renamed to 'ensure_all_finite' in 1.6 and will be removed in 1.8.
  warnings.warn(
/home/docs/checkouts/readthedocs.org/user_builds/pyts/envs/latest/lib/python3.12/site-packages/sklearn/utils/deprecation.py:132: FutureWarning: 'force_all_finite' was renamed to 'ensure_all_finite' in 1.6 and will be removed in 1.8.
  warnings.warn(
/home/docs/checkouts/readthedocs.org/user_builds/pyts/envs/latest/lib/python3.12/site-packages/sklearn/utils/deprecation.py:132: FutureWarning: 'force_all_finite' was renamed to 'ensure_all_finite' in 1.6 and will be removed in 1.8.
  warnings.warn(
/home/docs/checkouts/readthedocs.org/user_builds/pyts/envs/latest/lib/python3.12/site-packages/sklearn/utils/deprecation.py:132: FutureWarning: 'force_all_finite' was renamed to 'ensure_all_finite' in 1.6 and will be removed in 1.8.
  warnings.warn(
/home/docs/checkouts/readthedocs.org/user_builds/pyts/envs/latest/lib/python3.12/site-packages/sklearn/utils/deprecation.py:132: FutureWarning: 'force_all_finite' was renamed to 'ensure_all_finite' in 1.6 and will be removed in 1.8.
  warnings.warn(
/home/docs/checkouts/readthedocs.org/user_builds/pyts/envs/latest/lib/python3.12/site-packages/sklearn/utils/deprecation.py:132: FutureWarning: 'force_all_finite' was renamed to 'ensure_all_finite' in 1.6 and will be removed in 1.8.
  warnings.warn(
/home/docs/checkouts/readthedocs.org/user_builds/pyts/envs/latest/lib/python3.12/site-packages/sklearn/utils/deprecation.py:132: FutureWarning: 'force_all_finite' was renamed to 'ensure_all_finite' in 1.6 and will be removed in 1.8.
  warnings.warn(
/home/docs/checkouts/readthedocs.org/user_builds/pyts/envs/latest/lib/python3.12/site-packages/sklearn/utils/deprecation.py:132: FutureWarning: 'force_all_finite' was renamed to 'ensure_all_finite' in 1.6 and will be removed in 1.8.
  warnings.warn(
/home/docs/checkouts/readthedocs.org/user_builds/pyts/envs/latest/lib/python3.12/site-packages/sklearn/utils/deprecation.py:132: FutureWarning: 'force_all_finite' was renamed to 'ensure_all_finite' in 1.6 and will be removed in 1.8.
  warnings.warn(
/home/docs/checkouts/readthedocs.org/user_builds/pyts/envs/latest/lib/python3.12/site-packages/sklearn/utils/deprecation.py:132: FutureWarning: 'force_all_finite' was renamed to 'ensure_all_finite' in 1.6 and will be removed in 1.8.
  warnings.warn(
/home/docs/checkouts/readthedocs.org/user_builds/pyts/envs/latest/lib/python3.12/site-packages/sklearn/utils/deprecation.py:132: FutureWarning: 'force_all_finite' was renamed to 'ensure_all_finite' in 1.6 and will be removed in 1.8.
  warnings.warn(
/home/docs/checkouts/readthedocs.org/user_builds/pyts/envs/latest/lib/python3.12/site-packages/sklearn/utils/deprecation.py:132: FutureWarning: 'force_all_finite' was renamed to 'ensure_all_finite' in 1.6 and will be removed in 1.8.
  warnings.warn(
/home/docs/checkouts/readthedocs.org/user_builds/pyts/envs/latest/lib/python3.12/site-packages/sklearn/utils/deprecation.py:132: FutureWarning: 'force_all_finite' was renamed to 'ensure_all_finite' in 1.6 and will be removed in 1.8.
  warnings.warn(
/home/docs/checkouts/readthedocs.org/user_builds/pyts/envs/latest/lib/python3.12/site-packages/sklearn/utils/deprecation.py:132: FutureWarning: 'force_all_finite' was renamed to 'ensure_all_finite' in 1.6 and will be removed in 1.8.
  warnings.warn(
/home/docs/checkouts/readthedocs.org/user_builds/pyts/envs/latest/lib/python3.12/site-packages/sklearn/utils/deprecation.py:132: FutureWarning: 'force_all_finite' was renamed to 'ensure_all_finite' in 1.6 and will be removed in 1.8.
  warnings.warn(
/home/docs/checkouts/readthedocs.org/user_builds/pyts/envs/latest/lib/python3.12/site-packages/sklearn/utils/deprecation.py:132: FutureWarning: 'force_all_finite' was renamed to 'ensure_all_finite' in 1.6 and will be removed in 1.8.
  warnings.warn(
/home/docs/checkouts/readthedocs.org/user_builds/pyts/envs/latest/lib/python3.12/site-packages/sklearn/utils/deprecation.py:132: FutureWarning: 'force_all_finite' was renamed to 'ensure_all_finite' in 1.6 and will be removed in 1.8.
  warnings.warn(
/home/docs/checkouts/readthedocs.org/user_builds/pyts/envs/latest/lib/python3.12/site-packages/sklearn/utils/deprecation.py:132: FutureWarning: 'force_all_finite' was renamed to 'ensure_all_finite' in 1.6 and will be removed in 1.8.
  warnings.warn(
/home/docs/checkouts/readthedocs.org/user_builds/pyts/envs/latest/lib/python3.12/site-packages/sklearn/utils/deprecation.py:132: FutureWarning: 'force_all_finite' was renamed to 'ensure_all_finite' in 1.6 and will be removed in 1.8.
  warnings.warn(
/home/docs/checkouts/readthedocs.org/user_builds/pyts/envs/latest/lib/python3.12/site-packages/sklearn/utils/deprecation.py:132: FutureWarning: 'force_all_finite' was renamed to 'ensure_all_finite' in 1.6 and will be removed in 1.8.
  warnings.warn(
/home/docs/checkouts/readthedocs.org/user_builds/pyts/envs/latest/lib/python3.12/site-packages/sklearn/utils/deprecation.py:132: FutureWarning: 'force_all_finite' was renamed to 'ensure_all_finite' in 1.6 and will be removed in 1.8.
  warnings.warn(
/home/docs/checkouts/readthedocs.org/user_builds/pyts/envs/latest/lib/python3.12/site-packages/sklearn/utils/deprecation.py:132: FutureWarning: 'force_all_finite' was renamed to 'ensure_all_finite' in 1.6 and will be removed in 1.8.
  warnings.warn(
/home/docs/checkouts/readthedocs.org/user_builds/pyts/envs/latest/lib/python3.12/site-packages/sklearn/utils/deprecation.py:132: FutureWarning: 'force_all_finite' was renamed to 'ensure_all_finite' in 1.6 and will be removed in 1.8.
  warnings.warn(
/home/docs/checkouts/readthedocs.org/user_builds/pyts/envs/latest/lib/python3.12/site-packages/sklearn/utils/deprecation.py:132: FutureWarning: 'force_all_finite' was renamed to 'ensure_all_finite' in 1.6 and will be removed in 1.8.
  warnings.warn(
/home/docs/checkouts/readthedocs.org/user_builds/pyts/envs/latest/lib/python3.12/site-packages/sklearn/utils/deprecation.py:132: FutureWarning: 'force_all_finite' was renamed to 'ensure_all_finite' in 1.6 and will be removed in 1.8.
  warnings.warn(
/home/docs/checkouts/readthedocs.org/user_builds/pyts/envs/latest/lib/python3.12/site-packages/sklearn/utils/deprecation.py:132: FutureWarning: 'force_all_finite' was renamed to 'ensure_all_finite' in 1.6 and will be removed in 1.8.
  warnings.warn(
/home/docs/checkouts/readthedocs.org/user_builds/pyts/envs/latest/lib/python3.12/site-packages/sklearn/utils/deprecation.py:132: FutureWarning: 'force_all_finite' was renamed to 'ensure_all_finite' in 1.6 and will be removed in 1.8.
  warnings.warn(
/home/docs/checkouts/readthedocs.org/user_builds/pyts/envs/latest/lib/python3.12/site-packages/sklearn/utils/deprecation.py:132: FutureWarning: 'force_all_finite' was renamed to 'ensure_all_finite' in 1.6 and will be removed in 1.8.
  warnings.warn(
/home/docs/checkouts/readthedocs.org/user_builds/pyts/envs/latest/lib/python3.12/site-packages/sklearn/utils/deprecation.py:132: FutureWarning: 'force_all_finite' was renamed to 'ensure_all_finite' in 1.6 and will be removed in 1.8.
  warnings.warn(
/home/docs/checkouts/readthedocs.org/user_builds/pyts/envs/latest/lib/python3.12/site-packages/sklearn/utils/deprecation.py:132: FutureWarning: 'force_all_finite' was renamed to 'ensure_all_finite' in 1.6 and will be removed in 1.8.
  warnings.warn(
/home/docs/checkouts/readthedocs.org/user_builds/pyts/envs/latest/lib/python3.12/site-packages/sklearn/utils/deprecation.py:132: FutureWarning: 'force_all_finite' was renamed to 'ensure_all_finite' in 1.6 and will be removed in 1.8.
  warnings.warn(
/home/docs/checkouts/readthedocs.org/user_builds/pyts/envs/latest/lib/python3.12/site-packages/sklearn/utils/deprecation.py:132: FutureWarning: 'force_all_finite' was renamed to 'ensure_all_finite' in 1.6 and will be removed in 1.8.
  warnings.warn(
/home/docs/checkouts/readthedocs.org/user_builds/pyts/envs/latest/lib/python3.12/site-packages/sklearn/utils/deprecation.py:132: FutureWarning: 'force_all_finite' was renamed to 'ensure_all_finite' in 1.6 and will be removed in 1.8.
  warnings.warn(
/home/docs/checkouts/readthedocs.org/user_builds/pyts/envs/latest/lib/python3.12/site-packages/sklearn/utils/deprecation.py:132: FutureWarning: 'force_all_finite' was renamed to 'ensure_all_finite' in 1.6 and will be removed in 1.8.
  warnings.warn(
/home/docs/checkouts/readthedocs.org/user_builds/pyts/envs/latest/lib/python3.12/site-packages/sklearn/utils/deprecation.py:132: FutureWarning: 'force_all_finite' was renamed to 'ensure_all_finite' in 1.6 and will be removed in 1.8.
  warnings.warn(
/home/docs/checkouts/readthedocs.org/user_builds/pyts/envs/latest/lib/python3.12/site-packages/sklearn/utils/deprecation.py:132: FutureWarning: 'force_all_finite' was renamed to 'ensure_all_finite' in 1.6 and will be removed in 1.8.
  warnings.warn(
/home/docs/checkouts/readthedocs.org/user_builds/pyts/envs/latest/lib/python3.12/site-packages/sklearn/utils/deprecation.py:132: FutureWarning: 'force_all_finite' was renamed to 'ensure_all_finite' in 1.6 and will be removed in 1.8.
  warnings.warn(
/home/docs/checkouts/readthedocs.org/user_builds/pyts/envs/latest/lib/python3.12/site-packages/sklearn/utils/deprecation.py:132: FutureWarning: 'force_all_finite' was renamed to 'ensure_all_finite' in 1.6 and will be removed in 1.8.
  warnings.warn(
/home/docs/checkouts/readthedocs.org/user_builds/pyts/envs/latest/lib/python3.12/site-packages/sklearn/utils/deprecation.py:132: FutureWarning: 'force_all_finite' was renamed to 'ensure_all_finite' in 1.6 and will be removed in 1.8.
  warnings.warn(
/home/docs/checkouts/readthedocs.org/user_builds/pyts/envs/latest/lib/python3.12/site-packages/sklearn/utils/deprecation.py:132: FutureWarning: 'force_all_finite' was renamed to 'ensure_all_finite' in 1.6 and will be removed in 1.8.
  warnings.warn(
/home/docs/checkouts/readthedocs.org/user_builds/pyts/envs/latest/lib/python3.12/site-packages/sklearn/utils/deprecation.py:132: FutureWarning: 'force_all_finite' was renamed to 'ensure_all_finite' in 1.6 and will be removed in 1.8.
  warnings.warn(
/home/docs/checkouts/readthedocs.org/user_builds/pyts/envs/latest/lib/python3.12/site-packages/sklearn/utils/deprecation.py:132: FutureWarning: 'force_all_finite' was renamed to 'ensure_all_finite' in 1.6 and will be removed in 1.8.
  warnings.warn(
/home/docs/checkouts/readthedocs.org/user_builds/pyts/envs/latest/lib/python3.12/site-packages/sklearn/utils/deprecation.py:132: FutureWarning: 'force_all_finite' was renamed to 'ensure_all_finite' in 1.6 and will be removed in 1.8.
  warnings.warn(
/home/docs/checkouts/readthedocs.org/user_builds/pyts/envs/latest/lib/python3.12/site-packages/sklearn/utils/deprecation.py:132: FutureWarning: 'force_all_finite' was renamed to 'ensure_all_finite' in 1.6 and will be removed in 1.8.
  warnings.warn(
/home/docs/checkouts/readthedocs.org/user_builds/pyts/envs/latest/lib/python3.12/site-packages/sklearn/utils/deprecation.py:132: FutureWarning: 'force_all_finite' was renamed to 'ensure_all_finite' in 1.6 and will be removed in 1.8.
  warnings.warn(
/home/docs/checkouts/readthedocs.org/user_builds/pyts/envs/latest/lib/python3.12/site-packages/sklearn/utils/deprecation.py:132: FutureWarning: 'force_all_finite' was renamed to 'ensure_all_finite' in 1.6 and will be removed in 1.8.
  warnings.warn(
/home/docs/checkouts/readthedocs.org/user_builds/pyts/envs/latest/lib/python3.12/site-packages/sklearn/utils/deprecation.py:132: FutureWarning: 'force_all_finite' was renamed to 'ensure_all_finite' in 1.6 and will be removed in 1.8.
  warnings.warn(
/home/docs/checkouts/readthedocs.org/user_builds/pyts/envs/latest/lib/python3.12/site-packages/sklearn/utils/deprecation.py:132: FutureWarning: 'force_all_finite' was renamed to 'ensure_all_finite' in 1.6 and will be removed in 1.8.
  warnings.warn(
/home/docs/checkouts/readthedocs.org/user_builds/pyts/envs/latest/lib/python3.12/site-packages/sklearn/utils/deprecation.py:132: FutureWarning: 'force_all_finite' was renamed to 'ensure_all_finite' in 1.6 and will be removed in 1.8.
  warnings.warn(
/home/docs/checkouts/readthedocs.org/user_builds/pyts/envs/latest/lib/python3.12/site-packages/sklearn/utils/deprecation.py:132: FutureWarning: 'force_all_finite' was renamed to 'ensure_all_finite' in 1.6 and will be removed in 1.8.
  warnings.warn(
/home/docs/checkouts/readthedocs.org/user_builds/pyts/envs/latest/lib/python3.12/site-packages/sklearn/utils/deprecation.py:132: FutureWarning: 'force_all_finite' was renamed to 'ensure_all_finite' in 1.6 and will be removed in 1.8.
  warnings.warn(
/home/docs/checkouts/readthedocs.org/user_builds/pyts/envs/latest/lib/python3.12/site-packages/sklearn/utils/deprecation.py:132: FutureWarning: 'force_all_finite' was renamed to 'ensure_all_finite' in 1.6 and will be removed in 1.8.
  warnings.warn(
/home/docs/checkouts/readthedocs.org/user_builds/pyts/envs/latest/lib/python3.12/site-packages/sklearn/utils/deprecation.py:132: FutureWarning: 'force_all_finite' was renamed to 'ensure_all_finite' in 1.6 and will be removed in 1.8.
  warnings.warn(
/home/docs/checkouts/readthedocs.org/user_builds/pyts/envs/latest/lib/python3.12/site-packages/sklearn/utils/deprecation.py:132: FutureWarning: 'force_all_finite' was renamed to 'ensure_all_finite' in 1.6 and will be removed in 1.8.
  warnings.warn(
/home/docs/checkouts/readthedocs.org/user_builds/pyts/envs/latest/lib/python3.12/site-packages/sklearn/utils/deprecation.py:132: FutureWarning: 'force_all_finite' was renamed to 'ensure_all_finite' in 1.6 and will be removed in 1.8.
  warnings.warn(
/home/docs/checkouts/readthedocs.org/user_builds/pyts/envs/latest/lib/python3.12/site-packages/sklearn/utils/deprecation.py:132: FutureWarning: 'force_all_finite' was renamed to 'ensure_all_finite' in 1.6 and will be removed in 1.8.
  warnings.warn(
/home/docs/checkouts/readthedocs.org/user_builds/pyts/envs/latest/lib/python3.12/site-packages/sklearn/utils/deprecation.py:132: FutureWarning: 'force_all_finite' was renamed to 'ensure_all_finite' in 1.6 and will be removed in 1.8.
  warnings.warn(
/home/docs/checkouts/readthedocs.org/user_builds/pyts/envs/latest/lib/python3.12/site-packages/sklearn/utils/deprecation.py:132: FutureWarning: 'force_all_finite' was renamed to 'ensure_all_finite' in 1.6 and will be removed in 1.8.
  warnings.warn(
/home/docs/checkouts/readthedocs.org/user_builds/pyts/envs/latest/lib/python3.12/site-packages/sklearn/utils/deprecation.py:132: FutureWarning: 'force_all_finite' was renamed to 'ensure_all_finite' in 1.6 and will be removed in 1.8.
  warnings.warn(
/home/docs/checkouts/readthedocs.org/user_builds/pyts/envs/latest/lib/python3.12/site-packages/sklearn/utils/deprecation.py:132: FutureWarning: 'force_all_finite' was renamed to 'ensure_all_finite' in 1.6 and will be removed in 1.8.
  warnings.warn(
/home/docs/checkouts/readthedocs.org/user_builds/pyts/envs/latest/lib/python3.12/site-packages/sklearn/utils/deprecation.py:132: FutureWarning: 'force_all_finite' was renamed to 'ensure_all_finite' in 1.6 and will be removed in 1.8.
  warnings.warn(
/home/docs/checkouts/readthedocs.org/user_builds/pyts/envs/latest/lib/python3.12/site-packages/sklearn/utils/deprecation.py:132: FutureWarning: 'force_all_finite' was renamed to 'ensure_all_finite' in 1.6 and will be removed in 1.8.
  warnings.warn(
/home/docs/checkouts/readthedocs.org/user_builds/pyts/envs/latest/lib/python3.12/site-packages/sklearn/utils/deprecation.py:132: FutureWarning: 'force_all_finite' was renamed to 'ensure_all_finite' in 1.6 and will be removed in 1.8.
  warnings.warn(
/home/docs/checkouts/readthedocs.org/user_builds/pyts/envs/latest/lib/python3.12/site-packages/sklearn/utils/deprecation.py:132: FutureWarning: 'force_all_finite' was renamed to 'ensure_all_finite' in 1.6 and will be removed in 1.8.
  warnings.warn(
/home/docs/checkouts/readthedocs.org/user_builds/pyts/envs/latest/lib/python3.12/site-packages/sklearn/utils/deprecation.py:132: FutureWarning: 'force_all_finite' was renamed to 'ensure_all_finite' in 1.6 and will be removed in 1.8.
  warnings.warn(
/home/docs/checkouts/readthedocs.org/user_builds/pyts/envs/latest/lib/python3.12/site-packages/sklearn/utils/deprecation.py:132: FutureWarning: 'force_all_finite' was renamed to 'ensure_all_finite' in 1.6 and will be removed in 1.8.
  warnings.warn(
/home/docs/checkouts/readthedocs.org/user_builds/pyts/envs/latest/lib/python3.12/site-packages/sklearn/utils/deprecation.py:132: FutureWarning: 'force_all_finite' was renamed to 'ensure_all_finite' in 1.6 and will be removed in 1.8.
  warnings.warn(
/home/docs/checkouts/readthedocs.org/user_builds/pyts/envs/latest/lib/python3.12/site-packages/sklearn/utils/deprecation.py:132: FutureWarning: 'force_all_finite' was renamed to 'ensure_all_finite' in 1.6 and will be removed in 1.8.
  warnings.warn(
/home/docs/checkouts/readthedocs.org/user_builds/pyts/envs/latest/lib/python3.12/site-packages/sklearn/utils/deprecation.py:132: FutureWarning: 'force_all_finite' was renamed to 'ensure_all_finite' in 1.6 and will be removed in 1.8.
  warnings.warn(
/home/docs/checkouts/readthedocs.org/user_builds/pyts/envs/latest/lib/python3.12/site-packages/sklearn/utils/deprecation.py:132: FutureWarning: 'force_all_finite' was renamed to 'ensure_all_finite' in 1.6 and will be removed in 1.8.
  warnings.warn(
/home/docs/checkouts/readthedocs.org/user_builds/pyts/envs/latest/lib/python3.12/site-packages/sklearn/utils/deprecation.py:132: FutureWarning: 'force_all_finite' was renamed to 'ensure_all_finite' in 1.6 and will be removed in 1.8.
  warnings.warn(
/home/docs/checkouts/readthedocs.org/user_builds/pyts/envs/latest/lib/python3.12/site-packages/sklearn/utils/deprecation.py:132: FutureWarning: 'force_all_finite' was renamed to 'ensure_all_finite' in 1.6 and will be removed in 1.8.
  warnings.warn(
/home/docs/checkouts/readthedocs.org/user_builds/pyts/envs/latest/lib/python3.12/site-packages/sklearn/utils/deprecation.py:132: FutureWarning: 'force_all_finite' was renamed to 'ensure_all_finite' in 1.6 and will be removed in 1.8.
  warnings.warn(
/home/docs/checkouts/readthedocs.org/user_builds/pyts/envs/latest/lib/python3.12/site-packages/sklearn/utils/deprecation.py:132: FutureWarning: 'force_all_finite' was renamed to 'ensure_all_finite' in 1.6 and will be removed in 1.8.
  warnings.warn(
/home/docs/checkouts/readthedocs.org/user_builds/pyts/envs/latest/lib/python3.12/site-packages/sklearn/utils/deprecation.py:132: FutureWarning: 'force_all_finite' was renamed to 'ensure_all_finite' in 1.6 and will be removed in 1.8.
  warnings.warn(
/home/docs/checkouts/readthedocs.org/user_builds/pyts/envs/latest/lib/python3.12/site-packages/sklearn/utils/deprecation.py:132: FutureWarning: 'force_all_finite' was renamed to 'ensure_all_finite' in 1.6 and will be removed in 1.8.
  warnings.warn(
/home/docs/checkouts/readthedocs.org/user_builds/pyts/envs/latest/lib/python3.12/site-packages/sklearn/utils/deprecation.py:132: FutureWarning: 'force_all_finite' was renamed to 'ensure_all_finite' in 1.6 and will be removed in 1.8.
  warnings.warn(
/home/docs/checkouts/readthedocs.org/user_builds/pyts/envs/latest/lib/python3.12/site-packages/sklearn/utils/deprecation.py:132: FutureWarning: 'force_all_finite' was renamed to 'ensure_all_finite' in 1.6 and will be removed in 1.8.
  warnings.warn(
/home/docs/checkouts/readthedocs.org/user_builds/pyts/envs/latest/lib/python3.12/site-packages/sklearn/utils/deprecation.py:132: FutureWarning: 'force_all_finite' was renamed to 'ensure_all_finite' in 1.6 and will be removed in 1.8.
  warnings.warn(
/home/docs/checkouts/readthedocs.org/user_builds/pyts/envs/latest/lib/python3.12/site-packages/sklearn/utils/deprecation.py:132: FutureWarning: 'force_all_finite' was renamed to 'ensure_all_finite' in 1.6 and will be removed in 1.8.
  warnings.warn(
/home/docs/checkouts/readthedocs.org/user_builds/pyts/envs/latest/lib/python3.12/site-packages/sklearn/utils/deprecation.py:132: FutureWarning: 'force_all_finite' was renamed to 'ensure_all_finite' in 1.6 and will be removed in 1.8.
  warnings.warn(
/home/docs/checkouts/readthedocs.org/user_builds/pyts/envs/latest/lib/python3.12/site-packages/sklearn/utils/deprecation.py:132: FutureWarning: 'force_all_finite' was renamed to 'ensure_all_finite' in 1.6 and will be removed in 1.8.
  warnings.warn(
/home/docs/checkouts/readthedocs.org/user_builds/pyts/envs/latest/lib/python3.12/site-packages/sklearn/utils/deprecation.py:132: FutureWarning: 'force_all_finite' was renamed to 'ensure_all_finite' in 1.6 and will be removed in 1.8.
  warnings.warn(
/home/docs/checkouts/readthedocs.org/user_builds/pyts/envs/latest/lib/python3.12/site-packages/sklearn/utils/deprecation.py:132: FutureWarning: 'force_all_finite' was renamed to 'ensure_all_finite' in 1.6 and will be removed in 1.8.
  warnings.warn(
/home/docs/checkouts/readthedocs.org/user_builds/pyts/envs/latest/lib/python3.12/site-packages/sklearn/utils/deprecation.py:132: FutureWarning: 'force_all_finite' was renamed to 'ensure_all_finite' in 1.6 and will be removed in 1.8.
  warnings.warn(
/home/docs/checkouts/readthedocs.org/user_builds/pyts/envs/latest/lib/python3.12/site-packages/sklearn/utils/deprecation.py:132: FutureWarning: 'force_all_finite' was renamed to 'ensure_all_finite' in 1.6 and will be removed in 1.8.
  warnings.warn(
/home/docs/checkouts/readthedocs.org/user_builds/pyts/envs/latest/lib/python3.12/site-packages/sklearn/utils/deprecation.py:132: FutureWarning: 'force_all_finite' was renamed to 'ensure_all_finite' in 1.6 and will be removed in 1.8.
  warnings.warn(
/home/docs/checkouts/readthedocs.org/user_builds/pyts/envs/latest/lib/python3.12/site-packages/sklearn/utils/deprecation.py:132: FutureWarning: 'force_all_finite' was renamed to 'ensure_all_finite' in 1.6 and will be removed in 1.8.
  warnings.warn(
/home/docs/checkouts/readthedocs.org/user_builds/pyts/envs/latest/lib/python3.12/site-packages/sklearn/utils/deprecation.py:132: FutureWarning: 'force_all_finite' was renamed to 'ensure_all_finite' in 1.6 and will be removed in 1.8.
  warnings.warn(
/home/docs/checkouts/readthedocs.org/user_builds/pyts/envs/latest/lib/python3.12/site-packages/sklearn/utils/deprecation.py:132: FutureWarning: 'force_all_finite' was renamed to 'ensure_all_finite' in 1.6 and will be removed in 1.8.
  warnings.warn(
/home/docs/checkouts/readthedocs.org/user_builds/pyts/envs/latest/lib/python3.12/site-packages/sklearn/utils/deprecation.py:132: FutureWarning: 'force_all_finite' was renamed to 'ensure_all_finite' in 1.6 and will be removed in 1.8.
  warnings.warn(
/home/docs/checkouts/readthedocs.org/user_builds/pyts/envs/latest/lib/python3.12/site-packages/sklearn/utils/deprecation.py:132: FutureWarning: 'force_all_finite' was renamed to 'ensure_all_finite' in 1.6 and will be removed in 1.8.
  warnings.warn(
/home/docs/checkouts/readthedocs.org/user_builds/pyts/envs/latest/lib/python3.12/site-packages/sklearn/utils/deprecation.py:132: FutureWarning: 'force_all_finite' was renamed to 'ensure_all_finite' in 1.6 and will be removed in 1.8.
  warnings.warn(
/home/docs/checkouts/readthedocs.org/user_builds/pyts/envs/latest/lib/python3.12/site-packages/sklearn/utils/deprecation.py:132: FutureWarning: 'force_all_finite' was renamed to 'ensure_all_finite' in 1.6 and will be removed in 1.8.
  warnings.warn(
/home/docs/checkouts/readthedocs.org/user_builds/pyts/envs/latest/lib/python3.12/site-packages/sklearn/utils/deprecation.py:132: FutureWarning: 'force_all_finite' was renamed to 'ensure_all_finite' in 1.6 and will be removed in 1.8.
  warnings.warn(
/home/docs/checkouts/readthedocs.org/user_builds/pyts/envs/latest/lib/python3.12/site-packages/sklearn/utils/deprecation.py:132: FutureWarning: 'force_all_finite' was renamed to 'ensure_all_finite' in 1.6 and will be removed in 1.8.
  warnings.warn(
/home/docs/checkouts/readthedocs.org/user_builds/pyts/envs/latest/lib/python3.12/site-packages/sklearn/utils/deprecation.py:132: FutureWarning: 'force_all_finite' was renamed to 'ensure_all_finite' in 1.6 and will be removed in 1.8.
  warnings.warn(
/home/docs/checkouts/readthedocs.org/user_builds/pyts/envs/latest/lib/python3.12/site-packages/sklearn/utils/deprecation.py:132: FutureWarning: 'force_all_finite' was renamed to 'ensure_all_finite' in 1.6 and will be removed in 1.8.
  warnings.warn(
/home/docs/checkouts/readthedocs.org/user_builds/pyts/envs/latest/lib/python3.12/site-packages/sklearn/utils/deprecation.py:132: FutureWarning: 'force_all_finite' was renamed to 'ensure_all_finite' in 1.6 and will be removed in 1.8.
  warnings.warn(
/home/docs/checkouts/readthedocs.org/user_builds/pyts/envs/latest/lib/python3.12/site-packages/sklearn/utils/deprecation.py:132: FutureWarning: 'force_all_finite' was renamed to 'ensure_all_finite' in 1.6 and will be removed in 1.8.
  warnings.warn(
/home/docs/checkouts/readthedocs.org/user_builds/pyts/envs/latest/lib/python3.12/site-packages/sklearn/utils/deprecation.py:132: FutureWarning: 'force_all_finite' was renamed to 'ensure_all_finite' in 1.6 and will be removed in 1.8.
  warnings.warn(
/home/docs/checkouts/readthedocs.org/user_builds/pyts/envs/latest/lib/python3.12/site-packages/sklearn/utils/deprecation.py:132: FutureWarning: 'force_all_finite' was renamed to 'ensure_all_finite' in 1.6 and will be removed in 1.8.
  warnings.warn(
/home/docs/checkouts/readthedocs.org/user_builds/pyts/envs/latest/lib/python3.12/site-packages/sklearn/utils/deprecation.py:132: FutureWarning: 'force_all_finite' was renamed to 'ensure_all_finite' in 1.6 and will be removed in 1.8.
  warnings.warn(
/home/docs/checkouts/readthedocs.org/user_builds/pyts/envs/latest/lib/python3.12/site-packages/sklearn/utils/deprecation.py:132: FutureWarning: 'force_all_finite' was renamed to 'ensure_all_finite' in 1.6 and will be removed in 1.8.
  warnings.warn(
/home/docs/checkouts/readthedocs.org/user_builds/pyts/envs/latest/lib/python3.12/site-packages/sklearn/utils/deprecation.py:132: FutureWarning: 'force_all_finite' was renamed to 'ensure_all_finite' in 1.6 and will be removed in 1.8.
  warnings.warn(
/home/docs/checkouts/readthedocs.org/user_builds/pyts/envs/latest/lib/python3.12/site-packages/sklearn/utils/deprecation.py:132: FutureWarning: 'force_all_finite' was renamed to 'ensure_all_finite' in 1.6 and will be removed in 1.8.
  warnings.warn(
/home/docs/checkouts/readthedocs.org/user_builds/pyts/envs/latest/lib/python3.12/site-packages/sklearn/utils/deprecation.py:132: FutureWarning: 'force_all_finite' was renamed to 'ensure_all_finite' in 1.6 and will be removed in 1.8.
  warnings.warn(
/home/docs/checkouts/readthedocs.org/user_builds/pyts/envs/latest/lib/python3.12/site-packages/sklearn/utils/deprecation.py:132: FutureWarning: 'force_all_finite' was renamed to 'ensure_all_finite' in 1.6 and will be removed in 1.8.
  warnings.warn(
/home/docs/checkouts/readthedocs.org/user_builds/pyts/envs/latest/lib/python3.12/site-packages/sklearn/utils/deprecation.py:132: FutureWarning: 'force_all_finite' was renamed to 'ensure_all_finite' in 1.6 and will be removed in 1.8.
  warnings.warn(
/home/docs/checkouts/readthedocs.org/user_builds/pyts/envs/latest/lib/python3.12/site-packages/sklearn/utils/deprecation.py:132: FutureWarning: 'force_all_finite' was renamed to 'ensure_all_finite' in 1.6 and will be removed in 1.8.
  warnings.warn(
/home/docs/checkouts/readthedocs.org/user_builds/pyts/envs/latest/lib/python3.12/site-packages/sklearn/utils/deprecation.py:132: FutureWarning: 'force_all_finite' was renamed to 'ensure_all_finite' in 1.6 and will be removed in 1.8.
  warnings.warn(
/home/docs/checkouts/readthedocs.org/user_builds/pyts/envs/latest/lib/python3.12/site-packages/sklearn/utils/deprecation.py:132: FutureWarning: 'force_all_finite' was renamed to 'ensure_all_finite' in 1.6 and will be removed in 1.8.
  warnings.warn(
/home/docs/checkouts/readthedocs.org/user_builds/pyts/envs/latest/lib/python3.12/site-packages/sklearn/utils/deprecation.py:132: FutureWarning: 'force_all_finite' was renamed to 'ensure_all_finite' in 1.6 and will be removed in 1.8.
  warnings.warn(
/home/docs/checkouts/readthedocs.org/user_builds/pyts/envs/latest/lib/python3.12/site-packages/sklearn/utils/deprecation.py:132: FutureWarning: 'force_all_finite' was renamed to 'ensure_all_finite' in 1.6 and will be removed in 1.8.
  warnings.warn(
/home/docs/checkouts/readthedocs.org/user_builds/pyts/envs/latest/lib/python3.12/site-packages/sklearn/utils/deprecation.py:132: FutureWarning: 'force_all_finite' was renamed to 'ensure_all_finite' in 1.6 and will be removed in 1.8.
  warnings.warn(
/home/docs/checkouts/readthedocs.org/user_builds/pyts/envs/latest/lib/python3.12/site-packages/sklearn/utils/deprecation.py:132: FutureWarning: 'force_all_finite' was renamed to 'ensure_all_finite' in 1.6 and will be removed in 1.8.
  warnings.warn(
/home/docs/checkouts/readthedocs.org/user_builds/pyts/envs/latest/lib/python3.12/site-packages/sklearn/utils/deprecation.py:132: FutureWarning: 'force_all_finite' was renamed to 'ensure_all_finite' in 1.6 and will be removed in 1.8.
  warnings.warn(
/home/docs/checkouts/readthedocs.org/user_builds/pyts/envs/latest/lib/python3.12/site-packages/sklearn/utils/deprecation.py:132: FutureWarning: 'force_all_finite' was renamed to 'ensure_all_finite' in 1.6 and will be removed in 1.8.
  warnings.warn(
/home/docs/checkouts/readthedocs.org/user_builds/pyts/envs/latest/lib/python3.12/site-packages/sklearn/utils/deprecation.py:132: FutureWarning: 'force_all_finite' was renamed to 'ensure_all_finite' in 1.6 and will be removed in 1.8.
  warnings.warn(
/home/docs/checkouts/readthedocs.org/user_builds/pyts/envs/latest/lib/python3.12/site-packages/sklearn/utils/deprecation.py:132: FutureWarning: 'force_all_finite' was renamed to 'ensure_all_finite' in 1.6 and will be removed in 1.8.
  warnings.warn(
/home/docs/checkouts/readthedocs.org/user_builds/pyts/envs/latest/lib/python3.12/site-packages/sklearn/utils/deprecation.py:132: FutureWarning: 'force_all_finite' was renamed to 'ensure_all_finite' in 1.6 and will be removed in 1.8.
  warnings.warn(
/home/docs/checkouts/readthedocs.org/user_builds/pyts/envs/latest/lib/python3.12/site-packages/sklearn/utils/deprecation.py:132: FutureWarning: 'force_all_finite' was renamed to 'ensure_all_finite' in 1.6 and will be removed in 1.8.
  warnings.warn(
/home/docs/checkouts/readthedocs.org/user_builds/pyts/envs/latest/lib/python3.12/site-packages/sklearn/utils/deprecation.py:132: FutureWarning: 'force_all_finite' was renamed to 'ensure_all_finite' in 1.6 and will be removed in 1.8.
  warnings.warn(
/home/docs/checkouts/readthedocs.org/user_builds/pyts/envs/latest/lib/python3.12/site-packages/sklearn/utils/deprecation.py:132: FutureWarning: 'force_all_finite' was renamed to 'ensure_all_finite' in 1.6 and will be removed in 1.8.
  warnings.warn(
/home/docs/checkouts/readthedocs.org/user_builds/pyts/envs/latest/lib/python3.12/site-packages/sklearn/utils/deprecation.py:132: FutureWarning: 'force_all_finite' was renamed to 'ensure_all_finite' in 1.6 and will be removed in 1.8.
  warnings.warn(
/home/docs/checkouts/readthedocs.org/user_builds/pyts/envs/latest/lib/python3.12/site-packages/sklearn/utils/deprecation.py:132: FutureWarning: 'force_all_finite' was renamed to 'ensure_all_finite' in 1.6 and will be removed in 1.8.
  warnings.warn(
/home/docs/checkouts/readthedocs.org/user_builds/pyts/envs/latest/lib/python3.12/site-packages/sklearn/utils/deprecation.py:132: FutureWarning: 'force_all_finite' was renamed to 'ensure_all_finite' in 1.6 and will be removed in 1.8.
  warnings.warn(
/home/docs/checkouts/readthedocs.org/user_builds/pyts/envs/latest/lib/python3.12/site-packages/sklearn/utils/deprecation.py:132: FutureWarning: 'force_all_finite' was renamed to 'ensure_all_finite' in 1.6 and will be removed in 1.8.
  warnings.warn(
/home/docs/checkouts/readthedocs.org/user_builds/pyts/envs/latest/lib/python3.12/site-packages/sklearn/utils/deprecation.py:132: FutureWarning: 'force_all_finite' was renamed to 'ensure_all_finite' in 1.6 and will be removed in 1.8.
  warnings.warn(
/home/docs/checkouts/readthedocs.org/user_builds/pyts/envs/latest/lib/python3.12/site-packages/sklearn/utils/deprecation.py:132: FutureWarning: 'force_all_finite' was renamed to 'ensure_all_finite' in 1.6 and will be removed in 1.8.
  warnings.warn(
/home/docs/checkouts/readthedocs.org/user_builds/pyts/envs/latest/lib/python3.12/site-packages/sklearn/utils/deprecation.py:132: FutureWarning: 'force_all_finite' was renamed to 'ensure_all_finite' in 1.6 and will be removed in 1.8.
  warnings.warn(
/home/docs/checkouts/readthedocs.org/user_builds/pyts/envs/latest/lib/python3.12/site-packages/sklearn/utils/deprecation.py:132: FutureWarning: 'force_all_finite' was renamed to 'ensure_all_finite' in 1.6 and will be removed in 1.8.
  warnings.warn(
/home/docs/checkouts/readthedocs.org/user_builds/pyts/envs/latest/lib/python3.12/site-packages/sklearn/utils/deprecation.py:132: FutureWarning: 'force_all_finite' was renamed to 'ensure_all_finite' in 1.6 and will be removed in 1.8.
  warnings.warn(
/home/docs/checkouts/readthedocs.org/user_builds/pyts/envs/latest/lib/python3.12/site-packages/sklearn/utils/deprecation.py:132: FutureWarning: 'force_all_finite' was renamed to 'ensure_all_finite' in 1.6 and will be removed in 1.8.
  warnings.warn(
/home/docs/checkouts/readthedocs.org/user_builds/pyts/envs/latest/lib/python3.12/site-packages/sklearn/utils/deprecation.py:132: FutureWarning: 'force_all_finite' was renamed to 'ensure_all_finite' in 1.6 and will be removed in 1.8.
  warnings.warn(
/home/docs/checkouts/readthedocs.org/user_builds/pyts/envs/latest/lib/python3.12/site-packages/sklearn/utils/deprecation.py:132: FutureWarning: 'force_all_finite' was renamed to 'ensure_all_finite' in 1.6 and will be removed in 1.8.
  warnings.warn(
/home/docs/checkouts/readthedocs.org/user_builds/pyts/envs/latest/lib/python3.12/site-packages/sklearn/utils/deprecation.py:132: FutureWarning: 'force_all_finite' was renamed to 'ensure_all_finite' in 1.6 and will be removed in 1.8.
  warnings.warn(
/home/docs/checkouts/readthedocs.org/user_builds/pyts/envs/latest/lib/python3.12/site-packages/sklearn/utils/deprecation.py:132: FutureWarning: 'force_all_finite' was renamed to 'ensure_all_finite' in 1.6 and will be removed in 1.8.
  warnings.warn(
/home/docs/checkouts/readthedocs.org/user_builds/pyts/envs/latest/lib/python3.12/site-packages/sklearn/utils/deprecation.py:132: FutureWarning: 'force_all_finite' was renamed to 'ensure_all_finite' in 1.6 and will be removed in 1.8.
  warnings.warn(
/home/docs/checkouts/readthedocs.org/user_builds/pyts/envs/latest/lib/python3.12/site-packages/sklearn/utils/deprecation.py:132: FutureWarning: 'force_all_finite' was renamed to 'ensure_all_finite' in 1.6 and will be removed in 1.8.
  warnings.warn(
/home/docs/checkouts/readthedocs.org/user_builds/pyts/envs/latest/lib/python3.12/site-packages/sklearn/utils/deprecation.py:132: FutureWarning: 'force_all_finite' was renamed to 'ensure_all_finite' in 1.6 and will be removed in 1.8.
  warnings.warn(
/home/docs/checkouts/readthedocs.org/user_builds/pyts/envs/latest/lib/python3.12/site-packages/sklearn/utils/deprecation.py:132: FutureWarning: 'force_all_finite' was renamed to 'ensure_all_finite' in 1.6 and will be removed in 1.8.
  warnings.warn(
/home/docs/checkouts/readthedocs.org/user_builds/pyts/envs/latest/lib/python3.12/site-packages/sklearn/utils/deprecation.py:132: FutureWarning: 'force_all_finite' was renamed to 'ensure_all_finite' in 1.6 and will be removed in 1.8.
  warnings.warn(
/home/docs/checkouts/readthedocs.org/user_builds/pyts/envs/latest/lib/python3.12/site-packages/sklearn/utils/deprecation.py:132: FutureWarning: 'force_all_finite' was renamed to 'ensure_all_finite' in 1.6 and will be removed in 1.8.
  warnings.warn(
/home/docs/checkouts/readthedocs.org/user_builds/pyts/envs/latest/lib/python3.12/site-packages/sklearn/utils/deprecation.py:132: FutureWarning: 'force_all_finite' was renamed to 'ensure_all_finite' in 1.6 and will be removed in 1.8.
  warnings.warn(
/home/docs/checkouts/readthedocs.org/user_builds/pyts/envs/latest/lib/python3.12/site-packages/sklearn/utils/deprecation.py:132: FutureWarning: 'force_all_finite' was renamed to 'ensure_all_finite' in 1.6 and will be removed in 1.8.
  warnings.warn(
/home/docs/checkouts/readthedocs.org/user_builds/pyts/envs/latest/lib/python3.12/site-packages/sklearn/utils/deprecation.py:132: FutureWarning: 'force_all_finite' was renamed to 'ensure_all_finite' in 1.6 and will be removed in 1.8.
  warnings.warn(
/home/docs/checkouts/readthedocs.org/user_builds/pyts/envs/latest/lib/python3.12/site-packages/sklearn/utils/deprecation.py:132: FutureWarning: 'force_all_finite' was renamed to 'ensure_all_finite' in 1.6 and will be removed in 1.8.
  warnings.warn(
/home/docs/checkouts/readthedocs.org/user_builds/pyts/envs/latest/lib/python3.12/site-packages/sklearn/utils/deprecation.py:132: FutureWarning: 'force_all_finite' was renamed to 'ensure_all_finite' in 1.6 and will be removed in 1.8.
  warnings.warn(
/home/docs/checkouts/readthedocs.org/user_builds/pyts/envs/latest/lib/python3.12/site-packages/sklearn/utils/deprecation.py:132: FutureWarning: 'force_all_finite' was renamed to 'ensure_all_finite' in 1.6 and will be removed in 1.8.
  warnings.warn(
/home/docs/checkouts/readthedocs.org/user_builds/pyts/envs/latest/lib/python3.12/site-packages/sklearn/utils/deprecation.py:132: FutureWarning: 'force_all_finite' was renamed to 'ensure_all_finite' in 1.6 and will be removed in 1.8.
  warnings.warn(
/home/docs/checkouts/readthedocs.org/user_builds/pyts/envs/latest/lib/python3.12/site-packages/sklearn/utils/deprecation.py:132: FutureWarning: 'force_all_finite' was renamed to 'ensure_all_finite' in 1.6 and will be removed in 1.8.
  warnings.warn(
/home/docs/checkouts/readthedocs.org/user_builds/pyts/envs/latest/lib/python3.12/site-packages/sklearn/utils/deprecation.py:132: FutureWarning: 'force_all_finite' was renamed to 'ensure_all_finite' in 1.6 and will be removed in 1.8.
  warnings.warn(
/home/docs/checkouts/readthedocs.org/user_builds/pyts/envs/latest/lib/python3.12/site-packages/sklearn/utils/deprecation.py:132: FutureWarning: 'force_all_finite' was renamed to 'ensure_all_finite' in 1.6 and will be removed in 1.8.
  warnings.warn(
/home/docs/checkouts/readthedocs.org/user_builds/pyts/envs/latest/lib/python3.12/site-packages/sklearn/utils/deprecation.py:132: FutureWarning: 'force_all_finite' was renamed to 'ensure_all_finite' in 1.6 and will be removed in 1.8.
  warnings.warn(
/home/docs/checkouts/readthedocs.org/user_builds/pyts/envs/latest/lib/python3.12/site-packages/sklearn/utils/deprecation.py:132: FutureWarning: 'force_all_finite' was renamed to 'ensure_all_finite' in 1.6 and will be removed in 1.8.
  warnings.warn(
/home/docs/checkouts/readthedocs.org/user_builds/pyts/envs/latest/lib/python3.12/site-packages/sklearn/utils/deprecation.py:132: FutureWarning: 'force_all_finite' was renamed to 'ensure_all_finite' in 1.6 and will be removed in 1.8.
  warnings.warn(
/home/docs/checkouts/readthedocs.org/user_builds/pyts/envs/latest/lib/python3.12/site-packages/sklearn/utils/deprecation.py:132: FutureWarning: 'force_all_finite' was renamed to 'ensure_all_finite' in 1.6 and will be removed in 1.8.
  warnings.warn(
/home/docs/checkouts/readthedocs.org/user_builds/pyts/envs/latest/lib/python3.12/site-packages/sklearn/utils/deprecation.py:132: FutureWarning: 'force_all_finite' was renamed to 'ensure_all_finite' in 1.6 and will be removed in 1.8.
  warnings.warn(
/home/docs/checkouts/readthedocs.org/user_builds/pyts/envs/latest/lib/python3.12/site-packages/sklearn/utils/deprecation.py:132: FutureWarning: 'force_all_finite' was renamed to 'ensure_all_finite' in 1.6 and will be removed in 1.8.
  warnings.warn(
/home/docs/checkouts/readthedocs.org/user_builds/pyts/envs/latest/lib/python3.12/site-packages/sklearn/utils/deprecation.py:132: FutureWarning: 'force_all_finite' was renamed to 'ensure_all_finite' in 1.6 and will be removed in 1.8.
  warnings.warn(
/home/docs/checkouts/readthedocs.org/user_builds/pyts/envs/latest/lib/python3.12/site-packages/sklearn/utils/deprecation.py:132: FutureWarning: 'force_all_finite' was renamed to 'ensure_all_finite' in 1.6 and will be removed in 1.8.
  warnings.warn(
/home/docs/checkouts/readthedocs.org/user_builds/pyts/envs/latest/lib/python3.12/site-packages/sklearn/utils/deprecation.py:132: FutureWarning: 'force_all_finite' was renamed to 'ensure_all_finite' in 1.6 and will be removed in 1.8.
  warnings.warn(
/home/docs/checkouts/readthedocs.org/user_builds/pyts/envs/latest/lib/python3.12/site-packages/sklearn/utils/deprecation.py:132: FutureWarning: 'force_all_finite' was renamed to 'ensure_all_finite' in 1.6 and will be removed in 1.8.
  warnings.warn(
/home/docs/checkouts/readthedocs.org/user_builds/pyts/envs/latest/lib/python3.12/site-packages/sklearn/utils/deprecation.py:132: FutureWarning: 'force_all_finite' was renamed to 'ensure_all_finite' in 1.6 and will be removed in 1.8.
  warnings.warn(
/home/docs/checkouts/readthedocs.org/user_builds/pyts/envs/latest/lib/python3.12/site-packages/sklearn/utils/deprecation.py:132: FutureWarning: 'force_all_finite' was renamed to 'ensure_all_finite' in 1.6 and will be removed in 1.8.
  warnings.warn(
/home/docs/checkouts/readthedocs.org/user_builds/pyts/envs/latest/lib/python3.12/site-packages/sklearn/utils/deprecation.py:132: FutureWarning: 'force_all_finite' was renamed to 'ensure_all_finite' in 1.6 and will be removed in 1.8.
  warnings.warn(
/home/docs/checkouts/readthedocs.org/user_builds/pyts/envs/latest/lib/python3.12/site-packages/sklearn/utils/deprecation.py:132: FutureWarning: 'force_all_finite' was renamed to 'ensure_all_finite' in 1.6 and will be removed in 1.8.
  warnings.warn(
/home/docs/checkouts/readthedocs.org/user_builds/pyts/envs/latest/lib/python3.12/site-packages/sklearn/utils/deprecation.py:132: FutureWarning: 'force_all_finite' was renamed to 'ensure_all_finite' in 1.6 and will be removed in 1.8.
  warnings.warn(
/home/docs/checkouts/readthedocs.org/user_builds/pyts/envs/latest/lib/python3.12/site-packages/sklearn/utils/deprecation.py:132: FutureWarning: 'force_all_finite' was renamed to 'ensure_all_finite' in 1.6 and will be removed in 1.8.
  warnings.warn(
/home/docs/checkouts/readthedocs.org/user_builds/pyts/envs/latest/lib/python3.12/site-packages/sklearn/utils/deprecation.py:132: FutureWarning: 'force_all_finite' was renamed to 'ensure_all_finite' in 1.6 and will be removed in 1.8.
  warnings.warn(
/home/docs/checkouts/readthedocs.org/user_builds/pyts/envs/latest/lib/python3.12/site-packages/sklearn/utils/deprecation.py:132: FutureWarning: 'force_all_finite' was renamed to 'ensure_all_finite' in 1.6 and will be removed in 1.8.
  warnings.warn(
/home/docs/checkouts/readthedocs.org/user_builds/pyts/envs/latest/lib/python3.12/site-packages/sklearn/utils/deprecation.py:132: FutureWarning: 'force_all_finite' was renamed to 'ensure_all_finite' in 1.6 and will be removed in 1.8.
  warnings.warn(
/home/docs/checkouts/readthedocs.org/user_builds/pyts/envs/latest/lib/python3.12/site-packages/sklearn/utils/deprecation.py:132: FutureWarning: 'force_all_finite' was renamed to 'ensure_all_finite' in 1.6 and will be removed in 1.8.
  warnings.warn(
/home/docs/checkouts/readthedocs.org/user_builds/pyts/envs/latest/lib/python3.12/site-packages/sklearn/utils/deprecation.py:132: FutureWarning: 'force_all_finite' was renamed to 'ensure_all_finite' in 1.6 and will be removed in 1.8.
  warnings.warn(
/home/docs/checkouts/readthedocs.org/user_builds/pyts/envs/latest/lib/python3.12/site-packages/sklearn/utils/deprecation.py:132: FutureWarning: 'force_all_finite' was renamed to 'ensure_all_finite' in 1.6 and will be removed in 1.8.
  warnings.warn(
/home/docs/checkouts/readthedocs.org/user_builds/pyts/envs/latest/lib/python3.12/site-packages/sklearn/utils/deprecation.py:132: FutureWarning: 'force_all_finite' was renamed to 'ensure_all_finite' in 1.6 and will be removed in 1.8.
  warnings.warn(
/home/docs/checkouts/readthedocs.org/user_builds/pyts/envs/latest/lib/python3.12/site-packages/sklearn/utils/deprecation.py:132: FutureWarning: 'force_all_finite' was renamed to 'ensure_all_finite' in 1.6 and will be removed in 1.8.
  warnings.warn(
/home/docs/checkouts/readthedocs.org/user_builds/pyts/envs/latest/lib/python3.12/site-packages/sklearn/utils/deprecation.py:132: FutureWarning: 'force_all_finite' was renamed to 'ensure_all_finite' in 1.6 and will be removed in 1.8.
  warnings.warn(
/home/docs/checkouts/readthedocs.org/user_builds/pyts/envs/latest/lib/python3.12/site-packages/sklearn/utils/deprecation.py:132: FutureWarning: 'force_all_finite' was renamed to 'ensure_all_finite' in 1.6 and will be removed in 1.8.
  warnings.warn(
/home/docs/checkouts/readthedocs.org/user_builds/pyts/envs/latest/lib/python3.12/site-packages/sklearn/utils/deprecation.py:132: FutureWarning: 'force_all_finite' was renamed to 'ensure_all_finite' in 1.6 and will be removed in 1.8.
  warnings.warn(
/home/docs/checkouts/readthedocs.org/user_builds/pyts/envs/latest/lib/python3.12/site-packages/sklearn/utils/deprecation.py:132: FutureWarning: 'force_all_finite' was renamed to 'ensure_all_finite' in 1.6 and will be removed in 1.8.
  warnings.warn(
/home/docs/checkouts/readthedocs.org/user_builds/pyts/envs/latest/lib/python3.12/site-packages/sklearn/utils/deprecation.py:132: FutureWarning: 'force_all_finite' was renamed to 'ensure_all_finite' in 1.6 and will be removed in 1.8.
  warnings.warn(
/home/docs/checkouts/readthedocs.org/user_builds/pyts/envs/latest/lib/python3.12/site-packages/sklearn/utils/deprecation.py:132: FutureWarning: 'force_all_finite' was renamed to 'ensure_all_finite' in 1.6 and will be removed in 1.8.
  warnings.warn(
/home/docs/checkouts/readthedocs.org/user_builds/pyts/envs/latest/lib/python3.12/site-packages/sklearn/utils/deprecation.py:132: FutureWarning: 'force_all_finite' was renamed to 'ensure_all_finite' in 1.6 and will be removed in 1.8.
  warnings.warn(
/home/docs/checkouts/readthedocs.org/user_builds/pyts/envs/latest/lib/python3.12/site-packages/sklearn/utils/deprecation.py:132: FutureWarning: 'force_all_finite' was renamed to 'ensure_all_finite' in 1.6 and will be removed in 1.8.
  warnings.warn(
/home/docs/checkouts/readthedocs.org/user_builds/pyts/envs/latest/lib/python3.12/site-packages/sklearn/utils/deprecation.py:132: FutureWarning: 'force_all_finite' was renamed to 'ensure_all_finite' in 1.6 and will be removed in 1.8.
  warnings.warn(
/home/docs/checkouts/readthedocs.org/user_builds/pyts/envs/latest/lib/python3.12/site-packages/sklearn/utils/deprecation.py:132: FutureWarning: 'force_all_finite' was renamed to 'ensure_all_finite' in 1.6 and will be removed in 1.8.
  warnings.warn(
/home/docs/checkouts/readthedocs.org/user_builds/pyts/envs/latest/lib/python3.12/site-packages/sklearn/utils/deprecation.py:132: FutureWarning: 'force_all_finite' was renamed to 'ensure_all_finite' in 1.6 and will be removed in 1.8.
  warnings.warn(
/home/docs/checkouts/readthedocs.org/user_builds/pyts/envs/latest/lib/python3.12/site-packages/sklearn/utils/deprecation.py:132: FutureWarning: 'force_all_finite' was renamed to 'ensure_all_finite' in 1.6 and will be removed in 1.8.
  warnings.warn(
/home/docs/checkouts/readthedocs.org/user_builds/pyts/envs/latest/lib/python3.12/site-packages/sklearn/utils/deprecation.py:132: FutureWarning: 'force_all_finite' was renamed to 'ensure_all_finite' in 1.6 and will be removed in 1.8.
  warnings.warn(
/home/docs/checkouts/readthedocs.org/user_builds/pyts/envs/latest/lib/python3.12/site-packages/sklearn/utils/deprecation.py:132: FutureWarning: 'force_all_finite' was renamed to 'ensure_all_finite' in 1.6 and will be removed in 1.8.
  warnings.warn(
/home/docs/checkouts/readthedocs.org/user_builds/pyts/envs/latest/lib/python3.12/site-packages/sklearn/utils/deprecation.py:132: FutureWarning: 'force_all_finite' was renamed to 'ensure_all_finite' in 1.6 and will be removed in 1.8.
  warnings.warn(
/home/docs/checkouts/readthedocs.org/user_builds/pyts/envs/latest/lib/python3.12/site-packages/sklearn/utils/deprecation.py:132: FutureWarning: 'force_all_finite' was renamed to 'ensure_all_finite' in 1.6 and will be removed in 1.8.
  warnings.warn(
/home/docs/checkouts/readthedocs.org/user_builds/pyts/envs/latest/lib/python3.12/site-packages/sklearn/utils/deprecation.py:132: FutureWarning: 'force_all_finite' was renamed to 'ensure_all_finite' in 1.6 and will be removed in 1.8.
  warnings.warn(
/home/docs/checkouts/readthedocs.org/user_builds/pyts/envs/latest/lib/python3.12/site-packages/sklearn/utils/deprecation.py:132: FutureWarning: 'force_all_finite' was renamed to 'ensure_all_finite' in 1.6 and will be removed in 1.8.
  warnings.warn(
# Author: Lucas Plagwitz <lucas.plagwitz@uni-muenster.de>
# License: BSD-3-Clause

import itertools
import numpy as np
import matplotlib.pyplot as plt
from scipy.spatial.distance import euclidean
from scipy.cluster.hierarchy import dendrogram
from sklearn.metrics import homogeneity_score
from sklearn.cluster import AgglomerativeClustering

from pyts.metrics import dtw, boss
from pyts.transformation import BOSS
from pyts.datasets import make_cylinder_bell_funnel


def create_dist_matrix(dataset, dist_func, **kwargs):
    distance_mat = np.zeros((len(dataset), len(dataset)))
    for i, j in itertools.product(range(len(dataset)),
                                  range(len(dataset))):
        distance_mat[i, j] = dist_func(dataset[i], dataset[j], **kwargs)
    return distance_mat


def plot_dendrogram(model, **kwargs):
    # function copied from sklearn:
    # plot_agglomerative_dendrogram.html
    #
    # Create linkage matrix and then plot the dendrogram

    # create the counts of samples under each node
    counts = np.zeros(model.children_.shape[0])
    n_samples = len(model.labels_)
    for i, merge in enumerate(model.children_):
        current_count = 0
        for child_idx in merge:
            if child_idx < n_samples:
                current_count += 1  # leaf node
            else:
                current_count += counts[child_idx - n_samples]
        counts[i] = current_count
    linkage_matrix = np.column_stack(
        [model.children_, model.distances_, counts]
    ).astype(float)

    # Plot the corresponding dendrogram
    dendrogram(linkage_matrix,
               color_threshold=sorted(model.distances_)[-2], **kwargs)


n_samples = 14
fig, axes = plt.subplots(1, 3, figsize=(16, 8))

X, y = make_cylinder_bell_funnel(n_samples=n_samples, random_state=42,
                                 shuffle=False)
for k_axis, metric in enumerate(["Euclidean", "DTW", "BOSS"]):
    if metric == "DTW":
        dist_mat = create_dist_matrix(X, dtw)
    elif metric == "BOSS":
        dist_mat = create_dist_matrix(BOSS(sparse=False, n_bins=3,
                                           word_size=3).fit_transform(X),
                                      boss)
    else:
        dist_mat = create_dist_matrix(X, euclidean)

    model = AgglomerativeClustering(compute_full_tree=True,
                                    compute_distances=True,
                                    n_clusters=3, metric="precomputed",
                                    linkage="complete")
    cluster = model.fit_predict(dist_mat)
    score = round(homogeneity_score(labels_true=y, labels_pred=cluster), 2)

    plot_dendrogram(model, orientation='left', ax=axes[k_axis], labels=y)
    axes[k_axis].set_xticks([], [])
    axes[k_axis].set_title(metric, size='xx-large')
    axes[k_axis].set_xlabel(f"homogeneity score: {score}", size='xx-large')

plt.show()
Total running time of the script: ( 0 minutes 0.851 seconds)
