Note
Click here to download the full example code
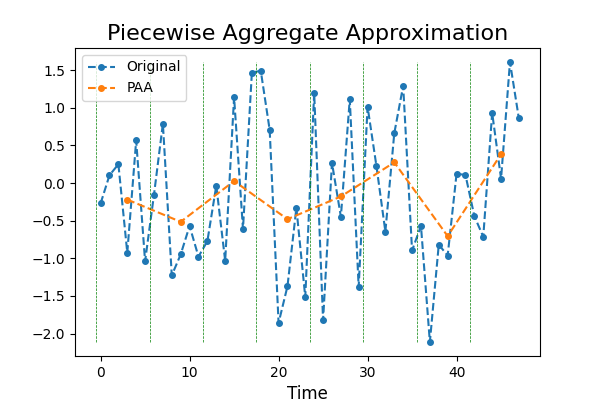
Piecewise Aggregate Approximation
Time series with a high sampling rate can be very noisy. In order to reduce
noise, a technique called Piecewise Aggregate Approximation was invented,
consisting in taking the mean over back-to-back points. This decreases the
number of points and reduces noise while preserving the trend of the time
series. This example illustrates the transformation.
It is implemented as
pyts.approximation.PiecewiseAggregateApproximation.
# Author: Johann Faouzi <johann.faouzi@gmail.com>
# License: BSD-3-Clause

import numpy as np
import matplotlib.pyplot as plt
from pyts.approximation import PiecewiseAggregateApproximation

# Parameters
n_samples, n_timestamps = 100, 48

# Toy dataset
rng = np.random.RandomState(41)
X = rng.randn(n_samples, n_timestamps)

# PAA transformation
window_size = 6
paa = PiecewiseAggregateApproximation(window_size=window_size)
X_paa = paa.transform(X)

# Show the results for the first time series
plt.figure(figsize=(6, 4))
plt.plot(X[0], 'o--', ms=4, label='Original')
plt.plot(np.arange(window_size // 2,
                   n_timestamps + window_size // 2,
                   window_size), X_paa[0], 'o--', ms=4, label='PAA')
plt.vlines(np.arange(0, n_timestamps, window_size) - 0.5,
           X[0].min(), X[0].max(), color='g', linestyles='--', linewidth=0.5)
plt.legend(loc='best', fontsize=10)
plt.xlabel('Time', fontsize=12)
plt.title('Piecewise Aggregate Approximation', fontsize=16)
plt.show()
Total running time of the script: ( 0 minutes 0.223 seconds)
