
SingularSpectrumAnalysis#
- class pyts.decomposition.SingularSpectrumAnalysis(window_size: int | float = 4, groups: int | str | ArrayLike | None = None, lower_frequency_bound: float = 0.075, lower_frequency_contribution: float = 0.85, chunksize: int | None = None, n_jobs: int | None = 1)[source]#
Singular Spectrum Analysis.
- Parameters:
- window_sizeint or float (default = 4)
Size of the sliding window (i.e. the size of each word). If float, it represents the percentage of the size of each time series and must be between 0 and 1. The window size will be computed as
max(2, ceil(window_size * n_timestamps)).- groupsNone, int, ‘auto’, or array-like (default = None)
The way the elementary matrices are grouped. If None, no grouping is performed. If an integer, it represents the number of groups and the bounds of the groups are computed using the resolved window size as
np.linspace(0, window_size, groups + 1).astype('int64'). If ‘auto’, then three groups are determined, containing trend, seasonal, and residual. If array-like, each element must be array-like and contain the indices for each group.- lower_frequency_boundfloat (default = 0.075)
The boundary of the periodogram to characterize trend, seasonal and residual components. It must be between 0 and 0.5. Ignored if
groupsis not set to ‘auto’.- lower_frequency_contributionfloat (default = 0.85)
The relative threshold to characterize trend, seasonal and residual components by considering the periodogram. It must be between 0 and 1. Ignored if
groupsis not set to ‘auto’.- chunksizeint or None (default = None)
If int, the transformation of the whole dataset is performed using chunks (batches) and
chunksizecorresponds to the maximum size of each chunk (batch). If None, the transformation is performed on the whole dataset at once. Performing the transformation with chunks is likely to be a bit slower but requires less memory.- n_jobsNone or int (default = None)
The number of jobs to use for the computation. Only used if
chunksizeis set to an integer.
References
[1]N. Golyandina, and A. Zhigljavsky, “Singular Spectrum Analysis for Time Series”. Springer-Verlag Berlin Heidelberg (2013).
[2]T. Alexandrov, “A Method of Trend Extraction Using Singular Spectrum Analysis”, REVSTAT (2008).
Examples
>>> from pyts.datasets import load_gunpoint
>>> from pyts.decomposition import SingularSpectrumAnalysis
>>> X, _, _, _ = load_gunpoint(return_X_y=True)
>>> transformer = SingularSpectrumAnalysis(window_size=5)
>>> X_new = transformer.transform(X)
>>> X_new.shape
(50, 5, 150)
Methods
__init__([window_size, groups, ...])fit([X, y])Pass.
fit_transform(X[, y])Fit to data, then transform it.
get_metadata_routing()Get metadata routing of this object.
get_params([deep])Get parameters for this estimator.
set_params(**params)Set the parameters of this estimator.
transform(X)Transform the provided data.
- __init__(window_size: int | float = 4, groups: int | str | ArrayLike | None = None, lower_frequency_bound: float = 0.075, lower_frequency_contribution: float = 0.85, chunksize: int | None = None, n_jobs: int | None = 1) None[source]#
- fit(X: ArrayLike | None = None, y: ArrayLike | None = None) Self[source]#
Pass.
- Parameters:
- X
ignored
- y
Ignored
- Returns:
- selfobject
- transform(X: ArrayLike) NDArray[float64][source]#
Transform the provided data.
- Parameters:
- Xarray-like, shape = (n_samples, n_timestamps)
- Returns:
- X_newarray-like, shape = (n_samples, n_splits, n_timestamps)
Transformed data.
n_splitsvalue depends on the value ofgroups. Ifgroups=None,n_splitsis equal towindow_size. Ifgroupsis an integer,n_splitsis equal togroups. Ifgroups='auto',n_splitsis equal to three. Ifgroupsis array-like,n_splitsis equal to the length ofgroups. Ifn_splits=1,X_newis squeezed and its shape is (n_samples, n_timestamps).
Examples using pyts.decomposition.SingularSpectrumAnalysis#
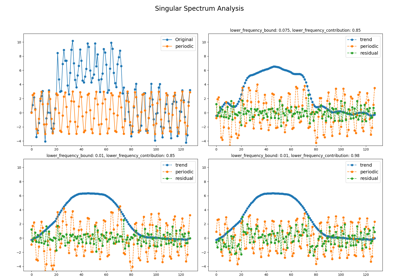
Trend-Seasonal decomposition with Singular Spectrum Analysis