Note
Click here to download the full example code
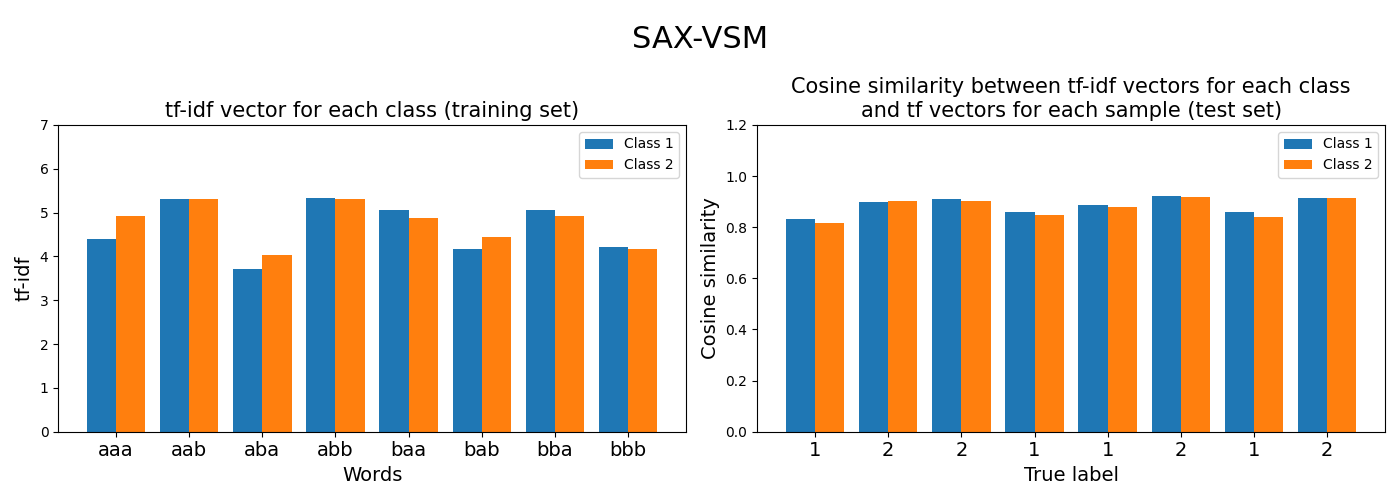
Symbolic Aggregate approXimation in Vector Space Model (SAX-VSM)
This example shows how the SAX-VSM algorithm transforms a dataset
consisting of time series and their corresponding labels into a
document-term matrix using tf-idf statistics. Each class is represented
as a tfidf vector. For an unlabeled time series, the predicted label is
the label of the tfidf vector giving the highest cosine similarity with
the tf vector of the unlabeled time series.
It is implemented as pyts.classification.SAXVSM.
# Author: Johann Faouzi <johann.faouzi@gmail.com>
# License: BSD-3-Clause

import numpy as np
import matplotlib.pyplot as plt
from pyts.classification import SAXVSM
from pyts.datasets import load_gunpoint

# Toy dataset
X_train, X_test, y_train, y_test = load_gunpoint(return_X_y=True)

# SAXVSM transformation
saxvsm = SAXVSM(window_size=15, word_size=3, n_bins=2,
                strategy='uniform')
saxvsm.fit(X_train, y_train)
tfidf = saxvsm.tfidf_
vocabulary_length = len(saxvsm.vocabulary_)
X_new = saxvsm.decision_function(X_test)

# Visualize the transformation
plt.figure(figsize=(14, 5))
width = 0.4

plt.subplot(121)
plt.bar(np.arange(vocabulary_length) - width / 2, tfidf[0],
        width=width, label='Class 1')
plt.bar(np.arange(vocabulary_length) + width / 2, tfidf[1],
        width=width, label='Class 2')
plt.xticks(np.arange(vocabulary_length),
           np.vectorize(saxvsm.vocabulary_.get)(np.arange(vocabulary_length)),
           fontsize=14)
plt.ylim((0, 7))
plt.xlabel("Words", fontsize=14)
plt.ylabel("tf-idf", fontsize=14)
plt.title("tf-idf vector for each class (training set)", fontsize=15)
plt.legend(loc='best')

plt.subplot(122)
n_samples_plot = 8
plt.bar(np.arange(n_samples_plot) - width / 2, X_new[:n_samples_plot, 0],
        width=width, label='Class 1')
plt.bar(np.arange(n_samples_plot) + width / 2, X_new[:n_samples_plot, 1],
        width=width, label='Class 2')
plt.xticks(np.arange(n_samples_plot), y_test[:n_samples_plot], fontsize=14)
plt.ylim((0, 1.2))
plt.xlabel("True label", fontsize=14)
plt.ylabel("Cosine similarity", fontsize=14)
plt.title(("Cosine similarity between tf-idf vectors for each class\n"
           "and tf vectors for each sample (test set)"), fontsize=15)
plt.legend(loc='best')

plt.suptitle("SAX-VSM", y=0.95, fontsize=22)
plt.tight_layout()
plt.subplots_adjust(top=0.75)
plt.show()
Total running time of the script: ( 0 minutes 0.922 seconds)
