Note
Click here to download the full example code
Learning Time-Series Shapelets
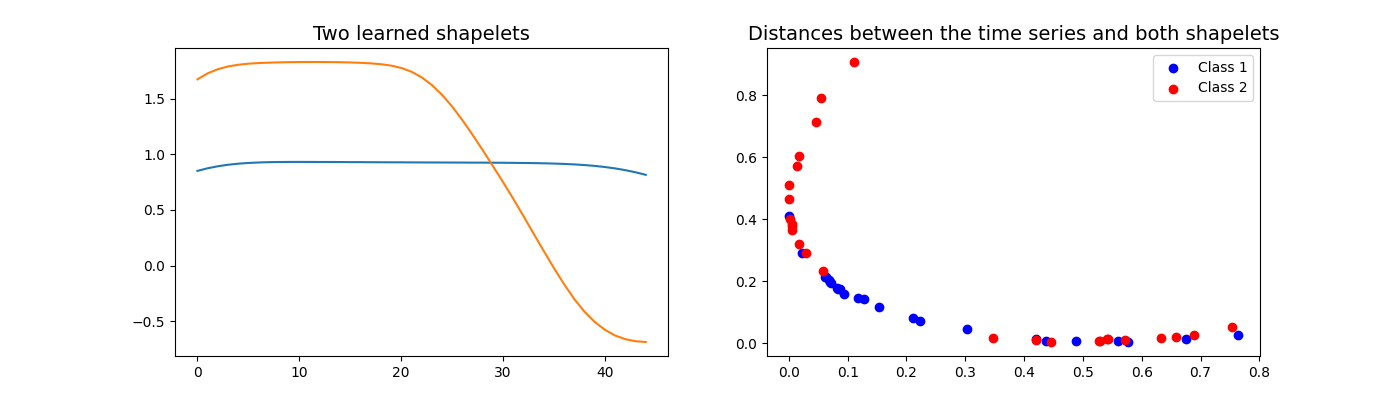
This example illustrates what the LearningShapelets algorithm learns in the training phase. A shapelet is defined as a contiguous subsequence of a time series. The distance between a shapelet and a time series is defined as the minimum of the distances between this shapelet and all the shapelets of identical length extracted from this time series. This estimator consists of two steps: computing the distances between the shapelets and the time series, then computing a logistic regression using these distances as features. This algorithm learns the shapelets as well as the coefficients of the logistic regression.
This example highlights two learned shapelets and the distances between the
time series and both shapelets. Note that the tolerance parameter is set to a
high value so that the algorithm converges early (and the example runs faster).
It is implemented as pyts.classification.LearningShapelets.
import matplotlib.pyplot as plt
import numpy as np
from pyts.classification import LearningShapelets
from pyts.datasets import load_gunpoint
from pyts.utils import windowed_view

# Load the data set and fit the classifier
X, _, y, _ = load_gunpoint(return_X_y=True)
clf = LearningShapelets(random_state=42, tol=0.01)
clf.fit(X, y)

# Select two shapelets
shapelets = np.asarray([clf.shapelets_[0, -9], clf.shapelets_[0, -12]])

# Derive the distances between the time series and the shapelets
shapelet_size = shapelets.shape[1]
X_window = windowed_view(X, window_size=shapelet_size, window_step=1)
X_dist = np.mean(
    (X_window[:, :, None] - shapelets[None, :]) ** 2, axis=3).min(axis=1)

plt.figure(figsize=(14, 4))

# Plot the two shapelets
plt.subplot(1, 2, 1)
plt.plot(shapelets[0])
plt.plot(shapelets[1])
plt.title('Two learned shapelets', fontsize=14)

# Plot the distances
plt.subplot(1, 2, 2)
for color, label in zip('br', (1, 2)):
    plt.scatter(X_dist[y == label, 0], X_dist[y == label, 1],
                c=color, label='Class {}'.format(label))
plt.title('Distances between the time series and both shapelets',
          fontsize=14)
plt.legend()
plt.show()
Total running time of the script: ( 0 minutes 9.874 seconds)
