Note
Click here to download the full example code
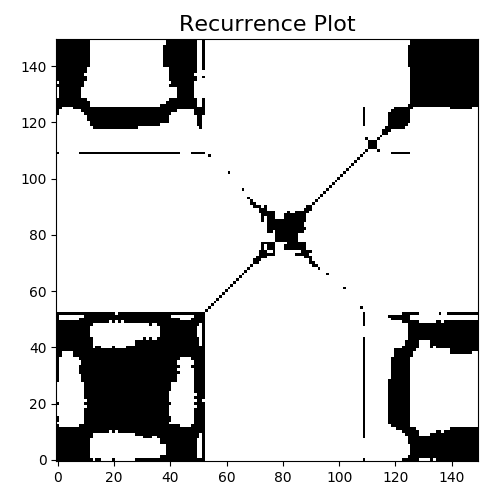
Recurrence Plot
A recurrence plot is an image obtained from a time series, representing the
distances between each time point. The image can be binarized using a
threshold. It is implemented as pyts.image.RecurrencePlot.
# Author: Johann Faouzi <johann.faouzi@gmail.com>
# License: BSD-3-Clause

import matplotlib.pyplot as plt
from pyts.image import RecurrencePlot
from pyts.datasets import load_gunpoint

X, _, _, _ = load_gunpoint(return_X_y=True)

# Recurrence plot transformation
rp = RecurrencePlot(threshold='point', percentage=20)
X_rp = rp.fit_transform(X)

# Show the results for the first time series
plt.figure(figsize=(5, 5))
plt.imshow(X_rp[0], cmap='binary', origin='lower')
plt.title('Recurrence Plot', fontsize=16)
plt.tight_layout()
plt.show()
Total running time of the script: ( 0 minutes 0.731 seconds)
