Note
Click here to download the full example code
Gramian Angular Field
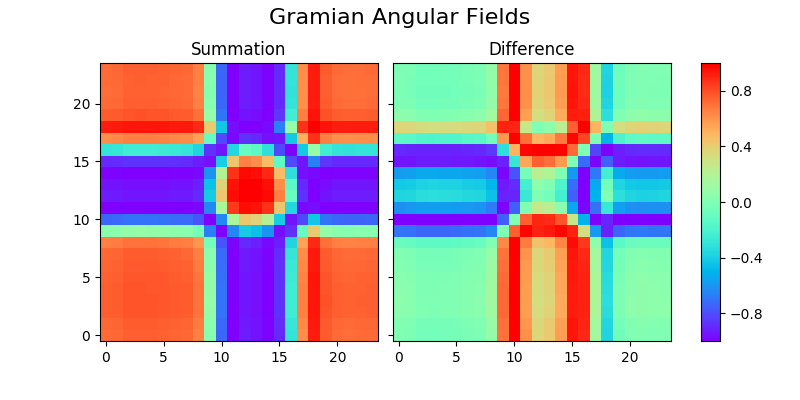
A Gramian Angular Field is an image obtained from a time series, representing
some temporal correlation between each time point. Two methods are
available: Gramian Angular Summation Field and Gramian Angular Difference
Field. This example illustrates the transformation on the first sample of
the GunPoint dataset. Both images are plotted side by side to illustrate
the differences.
It is implemented as pyts.image.GramianAngularField.
# Author: Johann Faouzi <johann.faouzi@gmail.com>
# License: BSD-3-Clause

import matplotlib.pyplot as plt
from mpl_toolkits.axes_grid1 import ImageGrid
from pyts.image import GramianAngularField
from pyts.datasets import load_gunpoint

# Parameters
X, _, _, _ = load_gunpoint(return_X_y=True)

# Transform the time series into Gramian Angular Fields
gasf = GramianAngularField(image_size=24, method='summation')
X_gasf = gasf.fit_transform(X)
gadf = GramianAngularField(image_size=24, method='difference')
X_gadf = gadf.fit_transform(X)

# Show the images for the first time series
fig = plt.figure(figsize=(8, 4))
grid = ImageGrid(fig, 111,
                 nrows_ncols=(1, 2),
                 axes_pad=0.15,
                 share_all=True,
                 cbar_location="right",
                 cbar_mode="single",
                 cbar_size="7%",
                 cbar_pad=0.3,
                 )
images = [X_gasf[0], X_gadf[0]]
titles = ['Summation', 'Difference']
for image, title, ax in zip(images, titles, grid):
    im = ax.imshow(image, cmap='rainbow', origin='lower')
    ax.set_title(title, fontdict={'fontsize': 12})
ax.cax.colorbar(im)
ax.cax.toggle_label(True)
plt.suptitle('Gramian Angular Fields', y=0.98, fontsize=16)
plt.show()
Total running time of the script: ( 0 minutes 3.007 seconds)
