Note
Click here to download the full example code
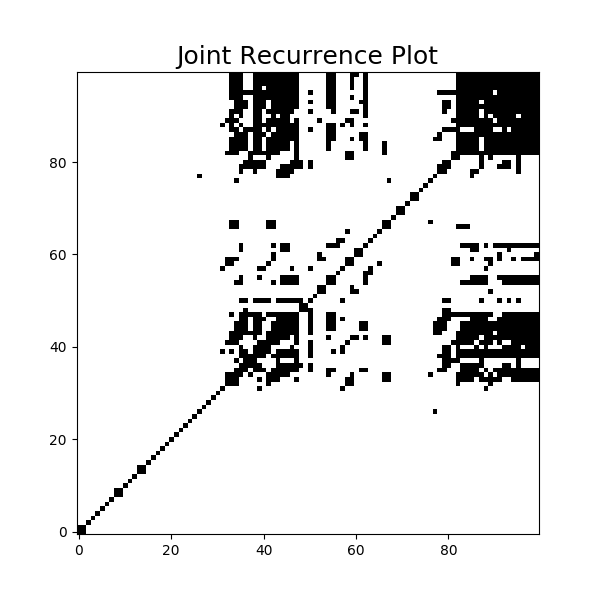
Joint Recurrence Plot
This example shows how to transform a multivariate time series into a joint
recurrence plot using pyts.multivariate.image.JointRecurrencePlot.
import matplotlib.pyplot as plt
from pyts.multivariate.image import JointRecurrencePlot
from pyts.datasets import load_basic_motions

X, _, _, _ = load_basic_motions(return_X_y=True)

# Recurrence plot transformation
jrp = JointRecurrencePlot(threshold='point', percentage=50)
X_jrp = jrp.fit_transform(X)

# Show the results for the first time series
plt.figure(figsize=(6, 6))
plt.imshow(X_jrp[0], cmap='binary', origin='lower')
plt.title('Joint Recurrence Plot', fontsize=18)
plt.show()
Total running time of the script: ( 0 minutes 0.649 seconds)